Indian Economy
Economic Survey 2025–26
For Prelims: Economic Survey, Chief Economic Adviser, Gross Fixed Capital Formation, Goods and Services Tax, SASCI, Non-performing Assets, Current account deficit, National Credit Framework, Samarth, Meri Panchayat
For Mains: India’s Economic Growth, Economic Survey, Fiscal Policy and Financial Stability, Challenges to Economic Growth.
Why in News?
The Union Minister for Finance and Corporate Affairs tabled the Economic Survey 2025–26 in Parliament, highlighting India’s resilience and positioning the economy as stable, investment-ready, and structurally strengthening amid global uncertainty.
Note: The Economic Survey is an annual government report presented before the Union Budget to assess India’s economic condition and outlook.
- It is prepared by the Economic Division of the Ministry of Finance under the Chief Economic Adviser, it reviews economic performance, sectoral trends, challenges, and prospects, and is tabled in both Houses of Parliament by the Union Finance Minister.
- First presented in 1950–51 as part of the Budget, it became a separate document in 1964.
What are the Key Highlights of the Economic Survey 2025–26?
State of the Economy
- Global growth is resilient but risks persist from geopolitics, trade fragmentation, and financial stress.
- The First Advance Estimates place Financial Year 2025-26 (FY26) Real GDP growth at 7.4% and Gross Value Added (GVA) growth at 7.3%. India retains strong growth momentum and is expected to grow by 6.8% – 7.2% in FY 2026 - 27, reaffirming its status as the fastest-growing major economy for the fourth consecutive year.
- Private Final Consumption Expenditure grew 7.0% in FY26, reaching 61.5% of GDP, the highest since 2012, supported by low inflation, stable employment, rising real incomes, strong rural demand from agriculture, and improved urban consumption due to tax rationalisation.
- Investment strengthened as Gross Fixed Capital Formation (GFCF) grew 7.8%, sustaining a 30% share of GDP, driven by public capex and reviving private investment.
- On the supply side, services remained the main growth driver, with services GVA at an estimated 9.1% growth for the full year.
Fiscal Developments
- Prudent fiscal management has strengthened India’s macroeconomic credibility. Centre’s revenue receipts rose from ~8.5% of GDP (FY16–20) to 9.2% in FY25 (PA), driven by higher non-corporate tax collections (~2.4% to ~3.3% of GDP).
- The direct tax base expanded, with income tax returns rising from 6.9 crore (FY22) to 9.2 crore (FY25).
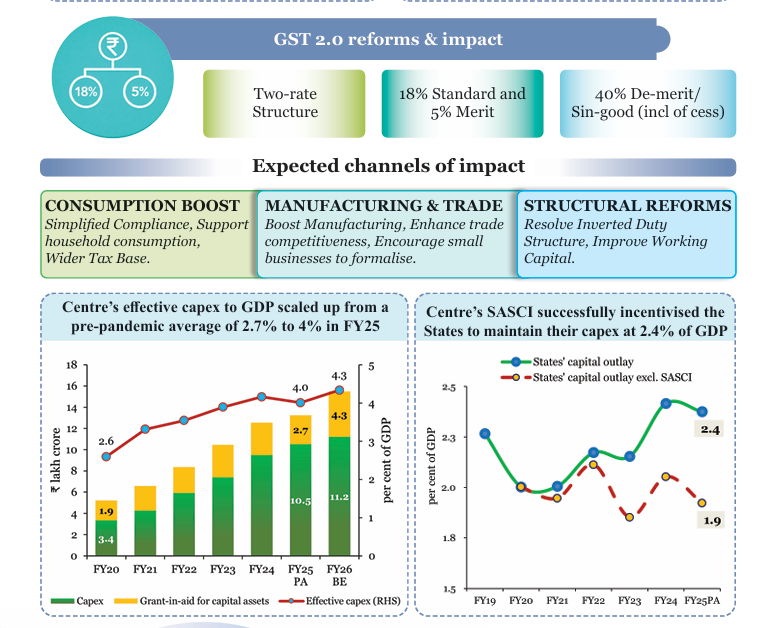
- Gross Goods and Services Tax (GST) collections during Apr–Dec 2025 stood at Rs 17.4 lakh crore (+6.7% YoY). GST 2.0 proposes a simplified two-rate structure to boost consumption, improve compliance, and enhance manufacturing competitiveness.
- Supporting this reform-led growth, the Centre’s effective capital expenditure (capex) rose from a pre-pandemic average of 2.7% of GDP to about 4% in FY25, while Special Assistance to States for Capital Expenditure (SASCI) successfully incentivised States to sustain capital outlay at ~2.4% of GDP, reinforcing public investment as a key demand and growth driver.
- State fiscal deficits edged up to 3.2% of GDP in FY25, even as India reduced its general government debt-to-GDP ratio by ~7.1% points since 2020 while maintaining high public investment.
Monetary Management & Financial Intermediation
- India’s monetary and financial sectors performed robustly in FY26 (Apr–Dec 2025).
- Banking sector asset quality improved significantly, with Gross Non-performing Assets (NPA) at 2.2% and net NPA at 0.5% in September 2025, while credit growth rose to 14.5% YoY by December 2025.
- Financial inclusion deepened, with Pradhan Mantri Jan Dhan Yojana (PMJDY) accounts reaching 55.02 crore, alongside expanded credit access through Stand-Up India, PM SVANidhi, and Pradhan Mantri Mudra Yojana (PMMY), which has disbursed Rs 36.18 lakh crore across 55.45 crore loan accounts.
- Capital market participation surged, with demat accounts exceeding 21.6 crore, 12 crore unique investors (nearly 25% women), and 5.9 crore mutual fund investors, increasingly from non-metro areas.
- Regulatory quality received global validation through the IMF–World Bank Financial Sector Assessment Program (FSAP) 2025, which highlighted a resilient and well-capitalised financial system, with total financial sector assets at ~187% of GDP and adequate buffers even under severe stress scenarios.
External Sector
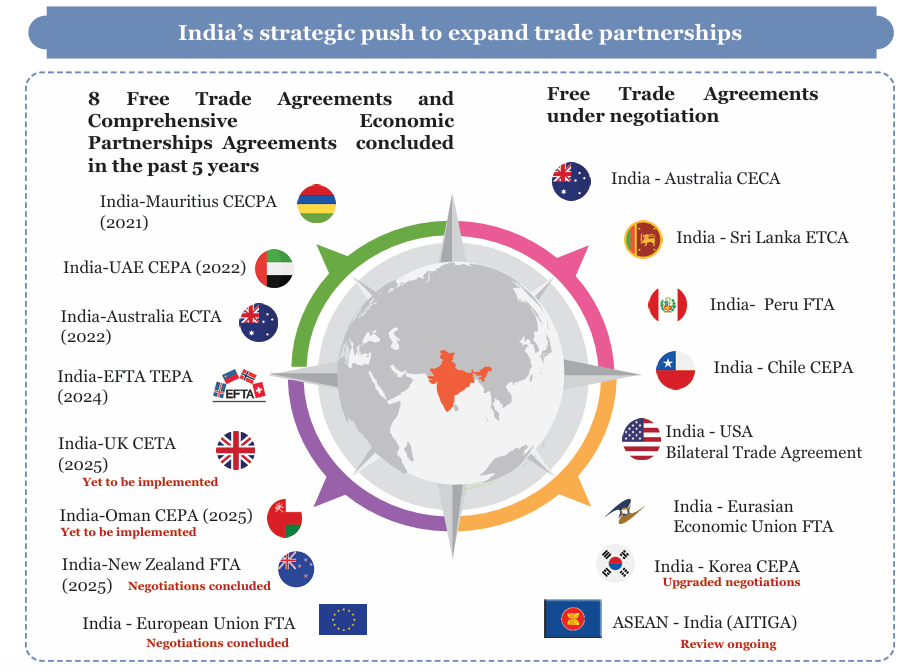
- India’s external sector strengthened markedly, with its share in global merchandise exports rising from 1% to 1.8% and services exports from 2% to 4.3% between 2005 and 2024, alongside high trade partner diversification.
- UNCTAD’s Trade and Development Report 2025 ranks India third in the Global South for trade partner diversification, outperforming all Global North economies.
- India diversified crude oil imports in FY26, increasing shares from the US, UAE, Egypt, Libya, and Nigeria, while reducing reliance on Russia and West Asian suppliers.
- This aligns with India’s strategy to mitigate geopolitical risks.
- Total exports touched a record USD 825.3 bn in FY25 ( 6.1% YoY growth), driven by services exports at an all-time high of USD 387.6 bn ( 13.6% YoY growth ).
- In FY25, non-petroleum, non-gems and jewellery exports constituted nearly four-fifths of aggregate merchandise exports.
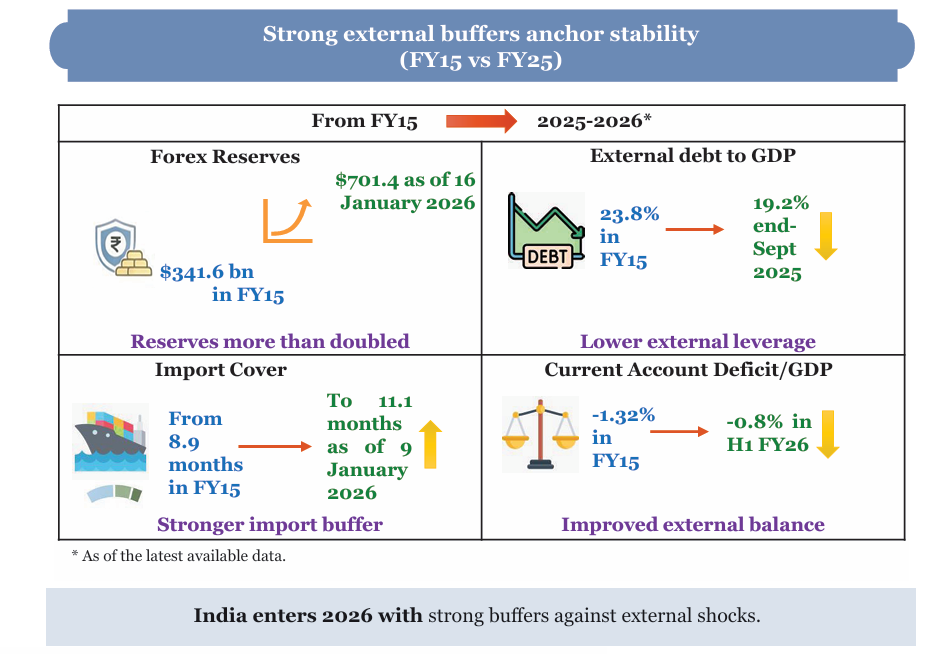
- The current account deficit (CAD) remained moderate (~1.3% of GDP in Q2 FY26), supported by strong services and record remittances of USD 135.4 bn, as forex reserves rose to USD 701.4 bn (11 months import cover).
- Despite a subdued global environment, India attracted USD 64.7 bn FDI (Apr–Nov 2025) and ranked 4th globally in Greenfield investments in 2024, emerging as the top destination for digital Greenfield projects during 2020–24.
Inflation
- India recorded its lowest-ever Consumer Price Index (CPI) inflation, with average headline inflation at 1.7% during Apr–Dec 2025, driven mainly by disinflation in food and fuel (52.7% of CPI basket).
- Among major Emerging Markets & Developing Economies (EMDEs), India saw one of the sharpest inflation declines.
Agriculture and Food Management
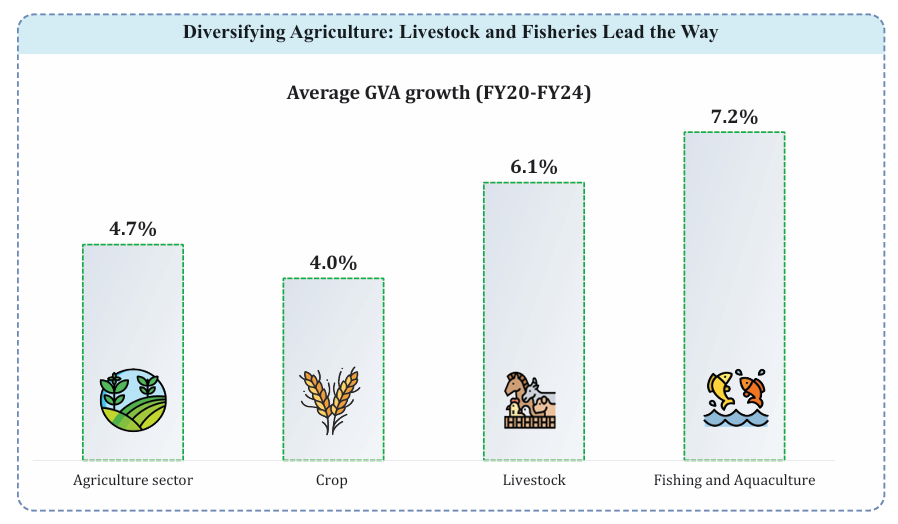
- India’s agriculture sector showed strong performance, with livestock GVA rising ~195% (FY15–FY24) and fish production increasing over 140% (2014–24).
- Supported by a good monsoon, foodgrain output reached a record 3,577.3 lakh metric tonnes (LMT) in AY 2024–25, while horticulture (33% of agri GVA) emerged as a key growth driver, surpassing foodgrains.
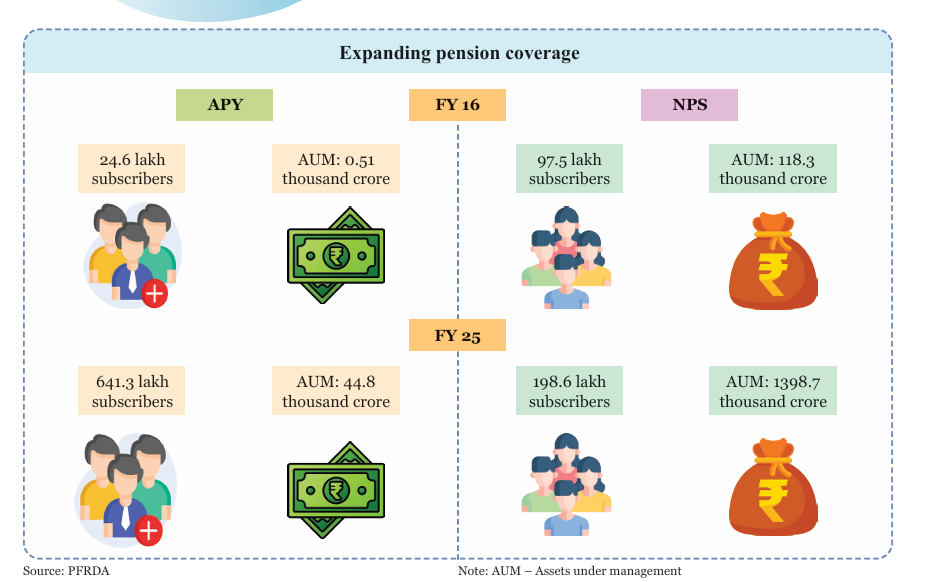
- Marketing and income support were strengthened through the Agriculture Infrastructure Fund (AIF), e-NAM, assured MSP, PM-KISAN and PM Kisan Maandhan Yojana (PMKMY) pension coverage, improving farm incomes and resilience.
Services
- India is the 7th-largest services exporter, with its global share rising from 2% (2005) to 4.3% (2024), and the services sector remains the largest FDI recipient, accounting for ~80% of total inflows in FY23–FY25.
- The services sector contributes significantly to employment, accounting for 30% of total jobs and 61.9% of urban employment.
- India has consolidated its position as a global technology and innovation hub, with expanding Global Capability Centres (GCCs).
- The country hosts the world’s third-largest technology startup ecosystem, with rapid scaling in GenAI startups, reflecting strong momentum in advanced digital and innovation-led sectors.
Industry’s Next Leap
- India ranks 12th globally in entrepreneurship policy and culture, 4th in trademarks, 6th in patents, and 7th in industrial designs (WIPO, 2024), reflecting a strengthening innovation ecosystem.
- It has also achieved a major critical technology breakthrough, placing among the top five globally in 45 of 64 critical technologies, up sharply from just four during 2003–07.
- India’s innovation ecosystem has strengthened steadily, with its Global Innovation Index rank improving from 81 (2015) to 38 (2025). DPIIT-recognised startups have grown rapidly to nearly 2 lakh by 2025.
- Patent applications nearly doubled between FY20–FY25, reflecting stronger innovation and IP activity.
- Production Linked Initiative (PLI) schemes attracted Rs 2.0 lakh crore investment, generated Rs 18.7 lakh crore output and 12.6 lakh jobs.
Investment and Infrastructure
- India’s infrastructure push intensified since FY18, with central capex rising 4.2 times from Rs 2.63 lakh crore (FY18) to Rs 11.21 lakh crore (FY26 BE) and effective capex at Rs 15.48 lakh crore (FY26 BE).
- Connectivity expanded FY14–FY26 through a 60% rise in national highway network,with near-100% rail electrification by Oct 2025, and India becoming the 3rd-largest domestic aviation market by 2025.
- National Highways network expanded from 91,287 km (FY14) to 1,46,572 km (FY26, up to Dec 2025), reflecting accelerated infrastructure build-out.
- Railway network length stands at 69,439 route km (as of March 2025), maintaining one of the world’s largest rail systems.
- Power demand–supply gap reduced sharply from 4.2% (FY14) to zero (Nov 2025), indicating near round-the-clock power availability.
- The power sector strengthened up to Nov 2025, with capacity reaching 509.74 GW, DISCOMs turning profitable in FY25.
- Tele-density reached 86.76%, and 5G services are now available in 99.9% of districts in the country.
- As of October 2025, over 81% of rural households have access to clean tap water under the Jal Jeevan Mission.
- India strengthened space infrastructure by becoming the fourth nation to achieve autonomous satellite docking (SpaDeX).
Environment and Climate Change
- As of December 2025, 38.61 GW of renewable capacity was added, led by 30.16 GW solar, 4.47 GW wind, 3.24 GW hydro, and 0.03 GW bio-power.
- The National Nuclear Energy Mission targets 5 indigenously designed Small Modular Reactors (SMRs) operational by 2033, expanding nuclear capacity from 8,780 MW to 100 GW by 2047, supported by the SHANTI Act 2025, which enables private participation.
- Environmental governance was streamlined via PARIVESH 3.0 single-window clearances, circular economy action plans.
Education and Health
- India is advancing towards universal access in education, targeting 100% Gross Enrolment Ratio (GER) in school education by 2030 and 50% GER in higher education by 2035.
- The school system covers ~25 crore students across 14.7 lakh schools with over 1 crore teachers, recording GERs of 90.9 (Grades I–V), 90.3 (VI–VIII), 78.7 (IX–X) and 58.4 (XI–XII).
- In higher education, 4.46 crore students are enrolled, with GER rising from 27.1 (2019–20) to 29.5 (2022–23).
- Higher education access expanded, alongside National Education Policy, 2020-led reforms such as National Credit Framework (NCrF) adoption, Academic Bank of Credit with APAAR (Automated Permanent Academic Account Registry) IDs with credits, and flexible entry–exit pathways in universities.
- India has made strong health gains, with maternal mortality rate (MMR) reduced by 86% since 1990, under- five mortality rate (U5MR) down 78%, and neonatal mortality rate (NMR) down 70%, all outperforming global averages.
- Infant Mortality Rate (IMR) fell by over 37%, from 40 (2013) to 25 (2023) deaths per thousand live births.
Employment and Skill Development
- India’s labour market remains resilient, with total employment at 56.2 crore (15+ age group) in Q2 FY26, reflecting net job creation of about 8.7 lakh over Q1 FY26 alongside economic expansion.
- Labour force participation rate rose from ~55% in April to ~56.1% by December, while unemployment stayed low at around 5% across Q1–Q2 FY26.
- Female labour force participation rate rose from 23.3% (2017–18) to 41.7% (2023–24), alongside a sharp decline in female unemployment from 5.6% to 3.2%, indicating stronger and more inclusive labour market outcomes.
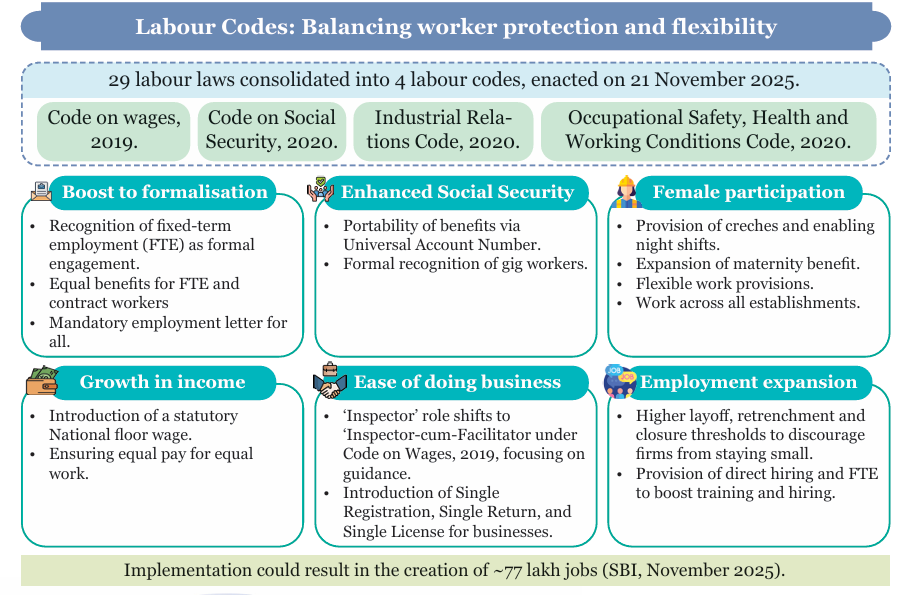
- Organised manufacturing employment rose 6% YoY in FY24 (over 10 lakh jobs), while Labour Codes expanded social security to gig and platform workers.
- e-Shram registered 31 crore unorganised workers (54% women), and the National Career Service connected 59 million job seekers with 5.3 million employers, mobilising ~80 million vacancies.
Rural Development and Social Progress
- Extreme poverty declined to 5.3% in 2022–23 under the revised USD 3.0/day poverty line of the World Bank. This progress has been supported by tech-driven rural initiatives such as SVAMITVA (mapping 3.28 lakh villages and issuing 2.76 crore property cards), Namo Drone Didi, and smart village models leveraging drones, solar power, and telemedicine.
- Participatory governance platforms like Samarth, Meri Panchayat, and eGramSwaraj have improved local planning and monitoring. Infrastructure expansion has ensured 99.6% rural connectivity, over 81% tap water coverage, and 2.9 crore houses constructed.
- Skill development and livelihoods were strengthened through DDU-GKY,and DAY-NRLM, with over 9 lakh community resource persons supporting women-led SHGs, food security, and stable rural incomes.
- The Survey justified scrapping MGNREGS, citing deep structural flaws and highlighted the Viksit Bharat Guarantee for Rozgar and Ajeevika Mission (Gramin) Act, 2025 as a comprehensive legislative reset.
Evolution of the AI Ecosystem in India
- India has strong AI fundamentals, with top-tier research output, a large talent pool, the 2nd most AI-literate workforce globally after the US, and vast yet underused domestic data across key sectors.
- Built on India’s ~1 billion connected users, the AI data framework balances openness, oversight, and domestic value creation through incentive-based compliance.
- It promotes local model training, domestic R&D funding, and upskilling to build sector-specific AI solutions for India’s development needs.
Urbanisation
- The Namo Bharat Regional Rapid Transit System (RRTS) shows how high-speed regional connectivity cuts travel time, expands job access, supports polycentric growth, and eases pressure on major cities.
- Waste management improved sharply, with door-to-door MSW collection covering 98% of urban wards and waste processing rising from 16% (2014–15) to 80% (2024–25).
Building Strategic Resilience and Strategic Indispensability
- The Survey calls for a shift from Strategic Resilience to Strategic Indispensability, urging India to move beyond defensive import substitution and become a critical node in global supply chains.
- It advocates intelligent, time-bound import substitution through a tiered indigenisation framework, while identifying state capacity as the key constraint—requiring an entrepreneurial state, regulatory experimentation, and protection for good-faith decision-making.
What are the Key Challenges Highlighted by the Economic Survey 2025–26?
- Global Uncertainty: The Survey highlights a shift from rules-based globalisation to geopolitical fragmentation, marked by strategic trade, supply-chain weaponisation, volatile capital flows, and rising resource nationalism (Pax Silica), making access to critical minerals, energy, technology, and finance increasingly uncertain.
- State Capacity as the Binding Constraint: India’s core challenge is weak state capacity, driven by bureaucratic risk aversion, fear of retrospective audits and vigilance inquiries, inability to reverse temporary policies (policy hysteresis), rather than mission-oriented governance.
- The Survey warns that the rapid expansion of unconditional cash transfers (Rs 1.7 lakh crore in FY26), though offering short-term relief, poses risks to fiscal sustainability and medium-term growth.
- It cautions that rising transfers crowd out productive capital expenditure, especially in revenue-deficit States.
- Competitiveness Issues: High energy, logistics, and raw-material costs act as an implicit tax on downstream manufacturing, weakening exports.
- The rupee remains structurally soft, backed by capital inflows instead of durable export surpluses, limiting external resilience.
- Low R&D: The private sector prioritises short-term profits and regulatory management over productivity-driven global competition.
- Underinvestment in R&D and frontier manufacturing and the absence of corporate stewardship of national productive capacity constrain long-term industrial capability.
- Societal Behavioural Constraints: A deficit of delayed gratification, shortcut-seeking behaviour, weak civic discipline, and neglect of the commons undermine reliable system-building and divert state capacity toward enforcement rather than development.
What Measures can Strengthen the Indian Economy?
- Manufacturing Push: Accelerate transition towards medium- and high-technology manufacturing, with strong momentum in electronics, EVs, pharmaceuticals, backed by PLI schemes.
- Agriculture Reorientation: Survey flags yield gaps versus global averages, calling for better seeds, crop diversification, and stronger extension services, FPO–PACS–SHG integration, and climate-resilient practices to boost productivity and sustainability.
- Infrastructure-led Investment: Sustain high public capex to crowd in private investment, supported by rapid expansion of highways, railways, ports, and logistics efficiency.
- Human Capital & Skilling: Align education and skills with industry needs through PMKVY 4.0, Skill Impact Bonds, apprenticeships, and NEP-led vocationalisation with flexible, credit-based learning pathways.
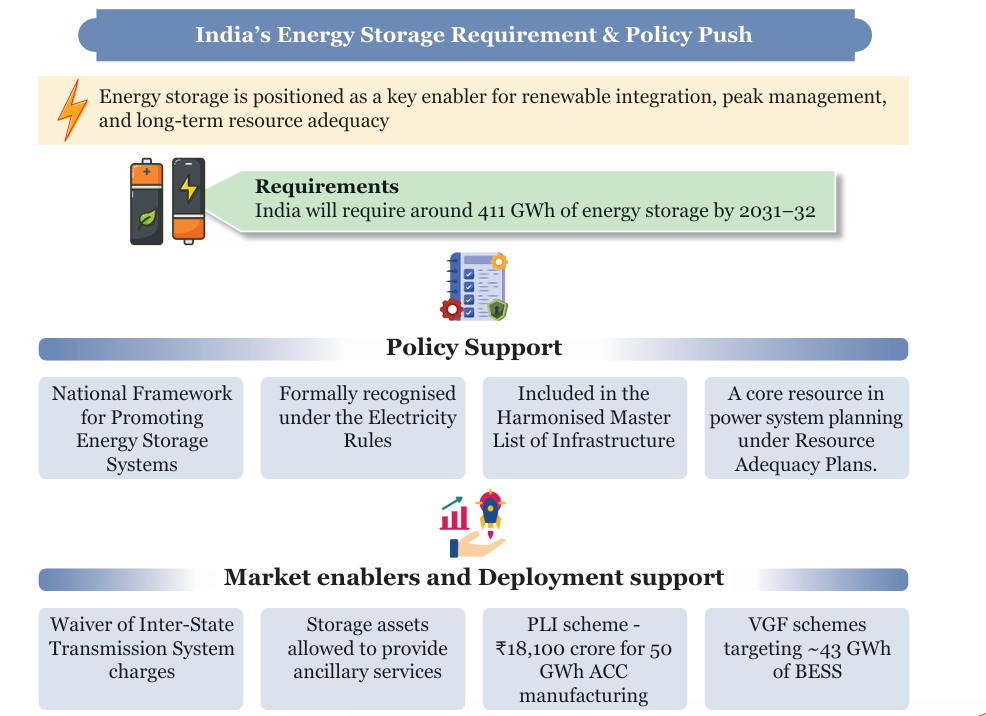
- Energy Transition & Sustainability: Advance the National Nuclear Energy Mission, scale battery energy storage, and deepen the circular economy through EPR and waste action plans.
- Urban Transformation: Unlock urban productivity by increasing FSI, strengthening ULB finances, and expanding public transport (metros, e-buses) to address congestion and sprawl.
- AI & Digital Strategy: Adopt a “Frugal AI” approach focused on application-specific AI, supported by trusted cross-border data flows with domestic value retention, ensuring Indian data strengthens local innovation and R&D.
- Climate Strategy: The Survey advocates a growth-aligned climate strategy, prioritising adaptation over near-term mitigation and viewing development as a key form of resilience.
- It cautions against rapid, infrastructure-blind energy transitions, citing grid stresses in Europe, and stresses the need for innovation, institutional capacity, and reliable non-fossil energy such as nuclear power.
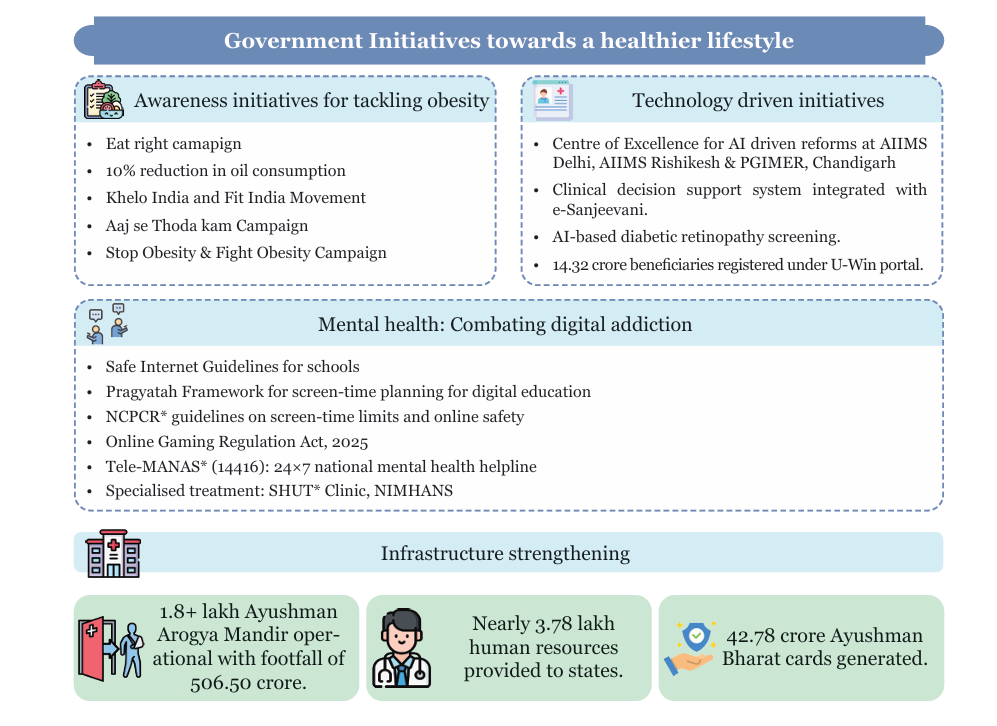
- Mental Health: The Survey flags digital addiction and screen-related mental health risks, especially among children, and calls for preventive, school-linked measures and expansion of Tele-MANAS beyond crisis care.
Conclusion
The Economic Survey 2025–26 projects India not merely as a resilient economy but as a rising anchor in the global order, transitioning from "Strategic Resilience" to "Strategic Indispensability." While macroeconomic fundamentals remain robust, India’s journey to becoming a developed nation will depend on aligning policy intent with execution, ensuring that growth is durable, inclusive, and deeply integrated into global value chains.
|
Drishti Mains Question: Analyse how India’s shift from Strategic Resilience to Strategic Indispensability reshapes its approach to global value chains and industrial policy |
Frequently Asked Questions
1. What is the Economic Survey?
The Economic Survey is an annual flagship document of the Government of India that reviews the state of the economy, sectoral trends, challenges, and prospects ahead of the Union Budget.
2. Who prepares and presents the Economic Survey?
It is prepared by the Economic Division of the Ministry of Finance under the Chief Economic Adviser (CEA) and tabled in Parliament by the Union Finance Minister.
3. When is the Economic Survey presented in Parliament?
It is usually presentedone day before the Union Budget in both Houses of Parliament.
4. When was the Economic Survey first introduced?
The Survey was first presented in 1950–51 as part of the Budget and became a separate document in 1964.
5. What are the core objectives of the Economic Survey?
To assess macroeconomic performance, analyse sectoral developments, identify structural challenges, and provide a forward-looking economic outlook.
6. How is the Economic Survey different from the Union Budget?
The Survey isanalytical and diagnostic, while the Budget is fiscal and policy-oriented, announcing taxes, expenditure, and allocations.
7. Which areas are typically covered in the Economic Survey?
Growth, inflation, fiscal policy, monetary sector, external sector, agriculture, industry, services, infrastructure, social sector, environment, and emerging issues likeAI and climate change.
UPSC Civil Services Examination, Previous Year Question (PYQ)
Prelims:
Q. Along with the Budget, the Finance Minister also places other documents before the Parliament which include ‘The Macro Economic Framework Statement’. The aforesaid document is presented because this is mandated by(2020)
(a) Long standing parliamentary convention
(b) Article 112 and Article 110(1) of the Constitution of India
(c) Article 113 of the Constitution of India
(d) Provisions of the Fiscal Responsibility and Budget Management Act, 2003
Ans: (d)
Mains:
Q. Distinguish between Capital Budget and Revenue Budget. Explain the components of both these Budgets.(2021)
Do you agree that the Indian economy has recently experienced a V- shapes recovery? Give reasons in support of your answer.(2021)
Q. “Industrial growth rate has lagged behind in the overall growth of Gross-Domestic-Product(GDP) in the post-reform period” Give reasons. How far are the recent changes in Industrial Policy capable of increasing the industrial growth rate? (2017)


Indian Economy
State Finances: A Study of Budgets of 2025–26
For Prelims: Demographic Transition, Fiscal Deficit, GST, Capital Expenditure, Scheme for Special Assistance to States for Capital Investment (SASCI), Consolidated Sinking Fund, Guarantee Redemption Fund, Total Fertility Rate (TFR), Demographic Winter, Tax Buoyancy, Silver Economy, ,National Pension System (NPS), Public Private Partnership, Green Hydrogen.
For Mains: Key findings of the RBI’s State Finances: A Study of Budgets of 2025–26, fiscal implications of India's demographic transition for state governments and way forward for harnessing the demographic dividend and mitigate the risks of ageing population.
Why in News?
The RBI’s State Finances: A Study of Budgets of 2025–26 report notes that India is at a critical demographic inflection point, with the need to harness the youth bulge while preparing for an ageing population.
- It stresses that tailored state-level fiscal strategies, aligned with different stages of demographic transition, are essential for sustainable economic growth.
Summary
- India’s States face varied demographic stages, demanding differentiated fiscal strategies.
- Youthful States require investment in education, skills, and job creation; Ageing States must prioritise healthcare and pensions.
- Capital expenditure, revenue mobilisation, and fiscal buffers are crucial for sustainable growth and debt management.
What are the Key Findings of the RBI's State Finances Report 2025-26?
- Demographic Diversity Across States: The median age varies from 23 years in Bihar to 37 years in Kerala, while the old-age dependency ratio ranges from 14.0 to 30.1, leading to the classification of states into Youthful, Intermediate, and Ageing categories, each requiring distinct fiscal approaches. It calls for differentiated fiscal strategies.
- Youthful States need higher spending on education, skilling, and job creation; Intermediate States should focus on infrastructure, urban reforms, and female workforce participation; Ageing States must prepare for higher healthcare, pension, and social welfare costs.
- Widened Fiscal Deficit: The states’ Gross Fiscal Deficit (GFD) widened to 3.3% in 2024-25 (from lower levels post-pandemic), primarily due to lower grants from the Centre (decline in GST compensation & revenue deficit grants).
- 16 States have budgeted a GFD exceeding 3% of GSDP for 2025-26, with 13 States surpassing 3.5%.
- State-Level Reforms for Revenue Growth: States' own tax base is highly concentrated, with State GST, sales tax, excise duties, and stamp duties constituting ~90% of collections. States are exploring non-tax revenue sources like mineral taxation and asset monetisation.
- Capital Push and Social Sector Focus: Capital expenditure has firmed up steadily, supported by the Centre's Scheme for Special Assistance to States for Capital Investment (SASCI). It is expected to increase up to 3.2% of GDP in 2025-26. Social sector expenditure is the major driver of revenue expenditure in 2025-26 (8.2% of GDP).
- Debt and Borrowings: Consolidated debt of States declined to 28.1% of GDP by March 2024 from a peak of 31% (March 2021), but is budgeted to rise to 29.2% by March 2026.
- Market borrowings now finance about 76% of the GFD (2025-26), indicating increased reliance.
- Interest payment burden remains manageable (Interest Payments-to-GDP stable at 1.5–1.9%), aided by concessional loans from the Centre.
- The maturity profile of State Government Securities (SGS) is elongating, with an increase in issuances beyond 10–15 years.
- Other Key Observations: Research & Development (R&D) expenditure by States is low (around 0.2–0.3% of GSDP) and dominated by medical and agricultural research.
- States are building fiscal buffers via the Consolidated Sinking Fund (CSF, Rs 2.4 lakh crore) and Guarantee Redemption Fund (GRF, Rs 16,019 crore).
- SASCI has been highly effective, with nearly full disbursement (Rs 1.49 lakh crore in 2024-25) and driving reforms.
Demographic Transition
- About: The demographic transition describes the historical shift from high to low birth and death rates as a country develops. It typically involves several stages.
- Stage 1: High birth and high death rates lead to a stable, low population.
- Stage 2: Death rates fall due to better healthcare and food security, while birth rates remain high, causing rapid population growth.
- Stage 3: Birth rates begin to decline due to urbanization, education, and family planning, slowing population growth.
- Stage 4: Both birth and death rates are low, leading to a stable or aging population.
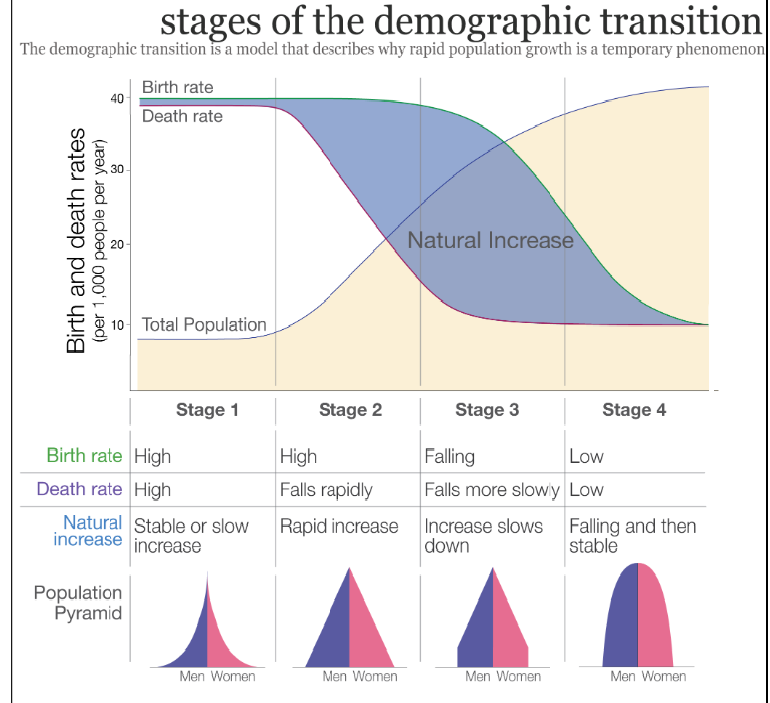
- India's Current Demographic Status: As per the 2011 Census, India is in Stage 3 of the demographic transition model.
- The Total Fertility Rate (TFR) has fallen to 2.0 (as per NFHS-5), which is below the replacement rate of 2.1. This means, on average, women are having fewer children than needed to maintain the current population size without migration.
- Future Projection: According to the UN's World Population Prospects 2024, India's population is expected to peak at around 1.7 billion in the early 2060s and then gradually decline, though it will remain the world's most populous country.
- Demographic Disaster: A demographic disaster occurs when a rapidly growing working-age population (15–64 years) fails to boost growth, creating unemployment, underemployment, social unrest, higher dependency, and long-term economic stagnation.
- Demographic Winter: The Demographic winter refers to a long-term population decline from low birth rates (below ~2.1 children per woman), causing a shrinking workforce, higher elder dependency, and strained social systems. China’s population fell for the fourth consecutive year in 2025, highlighting this trend.
What are the Fiscal Implications of India's Demographic Transition for State Governments?
|
Area |
Youthful States |
Intermediate States |
Ageing States |
|
Revenue Potential |
High potential tax buoyancy due to expanding working-age population, rising incomes, consumption, and labour participation. Requires productivity-enhancing investments to realise demographic dividend (e.g., Bihar, Uttar Pradesh). |
Stable but slowing revenue growth as workforce share peaks. Scope to tap skilled labour, services, and silver economy (senior citizens centered) (e.g., Telangana). |
Shrinking or stagnant tax bases as the working-age population declines. Lower income and consumption growth caps own-source revenues (e.g., Kerala, Punjab). |
|
Expenditure Composition |
High developmental spending needs on education, skilling, healthcare, and job creation to absorb youth bulge; lower old-age welfare burden initially. |
Dual expenditure pressure—continued investment in human capital alongside rising healthcare and social security demands. |
Rising committed expenditure on pensions, geriatric healthcare, and social security, crowding out infrastructure and education spending. |
|
Debt Sustainability & Fiscal Space |
Manageable debt outlook if growth-enhancing spending raises future revenues; risk of stress if youth dividend is missed. |
Tightening fiscal space as welfare obligations rise while revenue growth moderates; careful debt management required. |
High stress on debt sustainability due to rising welfare spending, and high interest payments; fiscal deficits risk exceeding 3% of GSDP. |
|
Fiscal Buffers, Transfers & Productivity |
Need to build early fiscal buffers and invest in productive capex; benefit relatively from current Finance Commission devolution norms based on population size. |
Strategic focus on expenditure quality, R&D, and technology to offset future ageing effects; gradual buffer creation. |
Strong need for fiscal buffers, prudent contingent liability management (pensions), higher R&D spending, and reform of devolution criteria to reflect higher old-age dependency ratios. |
How can States Harness the Demographic Dividend and Mitigate the Risks of Ageing Population?
Harnessing the Demographic Dividend
- Hyper-Local Skill Matching: Use AI-driven platforms to map local industry demand in real-time with the skill profiles of youth, creating dynamic, district-level apprenticeship and job-matching ecosystems.
- Create ‘Opportunity Corridors’ in Emerging Sectors: Identify and develop specialized industrial/technology corridors focused on future sectors (e.g., green hydrogen, semiconductors, space technology) with pre-approved land, plug-and-play infrastructure, and fast-tracked clearances to attract investment and high-quality jobs.
- Implement a ‘Learn-Earn-Pension’ Continuum: Bundle student loans with guaranteed internship stipends and an option to auto-enroll a micro-contribution into the National Pension System (NPS) upon first employment, fostering long-term financial security from the start of a career.
- Foster District as an Export Hub (DEH) Model: Empower districts with high youth populations to specialize in niche products (handicrafts, textiles, food processing). Provide integrated support for branding, e-commerce onboarding, logistics, and meeting global quality standards to turn local talent into global entrepreneurs.
Mitigating Risks of Population Ageing
- Develop Silver Economy Clusters: Incentivize the private sector to develop integrated townships or clusters with age-friendly housing, accessible healthcare facilities, recreation centers, and geriatric care services, creating new economic ecosystems and reducing public infrastructure burden.
- Elderpreneurship Schemes: Partner with industry to design flexible, part-time, and consultancy-based roles for experienced retirees. Provide seed grants and incubation support for seniors to start social enterprises or knowledge-based consultancies.
- Sub-National Longevity Funds: Create dedicated state-level funds, potentially through public-private partnerships, to invest in and subsidize preventive healthcare, telemedicine, assistive technologies, and drug research for age-related diseases.
Conclusion
India’s demographic transition presents both opportunities and challenges for State finances. Harnessing the youth bulge through skill development, employment, and innovation can boost revenue, while ageing populations require fiscal buffers, social security, and healthcare preparedness. Tailored, stage-specific fiscal strategies are essential for sustainable growth and intergenerational equity.
|
Drishti Mains Question: Examine the fiscal implications of India’s demographic transition for State governments and suggest measures for sustainable finances. |
Frequently Asked Questions (FAQs)
1. What is the Gross Fiscal Deficit (GFD) trend for States in 2025-26?
States budgeted a GFD of 3.3% of GDP, with 16 States exceeding 3% and 13 States surpassing 3.5% of GSDP.
2. What is the primary reason for the widening of the Gross Fiscal Deficit (GFD) of states in 2024-25?
It was primarily driven by lower revenue receipts due to a sharp decline in grants from the Centre, including reduced GST compensation and post-devolution revenue deficit grants.
3. Which States are classified as Youthful, Intermediate, and Ageing?
Youthful: Bihar, Uttar Pradesh; Intermediate: Telangana; Ageing: Kerala, Punjab, based on median age and old-age dependency ratios.
UPSC Civil Services Examination, Previous Year Questions (PYQs)
Prelims
Q. To obtain full benefits of demographic dividend, what should India do? (2013)
(a) Promoting skill development
(b) Introducing more social security schemes
(c) Reducing infant mortality rate
(d) Privatization of higher education
Ans: (a)
Q. Consider the following specific stages of demographic transition associated with economic development: (2012)
- Low birthrate with low death rate
- High birthrate with high death rate
- High birthrate with low death rate
Select the correct order of the above stages using the codes given below:
(a) 1, 2, 3
(b) 2, 1, 3
(c) 2, 3, 1
(d) 3, 2, 1
Ans: (c)
Mains
Q. What is the concept of a ‘demographic winter’? Is the world moving towards such a situation? Elaborate. (2024)
Q. Discuss the main objectives of Population Education and point out the measures to achieve them in India in detail. (2021)
Q. ‘’Empowering women is the key to control the population growth.’’ Discuss. (2019)
Q. Critically examine the effect of globalization on the aged population in India. (2013)


Important Facts For Prelims
Split Verdict on Section 17A
Why in News?
A Supreme Court (SC) two-judge bench has delivered a split verdict on the constitutional validity of Section 17A of the Prevention of Corruption Act, 1988, reigniting the core debate between insulating honest officials and ensuring unhindered corruption probes.
What is the Prevention of Corruption Act (PCA), 1988?
- About PCA, 1988: PCA, 1988 is India's principal anti-corruption law, enacted on the Santhanam Committee's recommendations (1962-64).
- It broadly defines a "public servant" to include government employees, judges, and anyone performing a public duty, and it criminalizes offenses such as bribery, undue advantage, and criminal misconduct.
- The Act specifically provides punishment for these offenses committed by public servants in the discharge of their official functions.
- Origin & Objective of Section 17A: Introduced via the 2018 amendment to the PCA, 1988, the section was enacted to create a "safe zone" for decision-making by protecting officers from investigation for decisions taken in good faith, thereby preventing 'play-it-safe syndrome' in the bureaucracy.
- Section 17A of the PCA, 1988 requires investigative agencies (like the CBI or police) to obtain prior approval from the concerned government authority before starting an inquiry or investigation into a public servant's official acts.
- Section 17A is distinct from Section 19 of the PCA, 1988, which mandates prior sanction from the appropriate government at the prosecution stage in a court of law.
- Split Verdict:
- Justice K.V. Viswanathan (Upholding with Condition): Held that prior approval is necessary to shield honest officers from vexatious and frivolous complaints. However, its validity is conditional – approval must be based on a binding opinion from an independent authority (Lokpal for Centre, Lokayuktas for States), not the government itself.
- Justice B.V. Nagarathna (Striking Down): She declared Section 17A unconstitutional, calling it "old wine in a new bottle", and ruled that it violates Article 14 (Equality before law). She also emphasized that Section 19 already provides sufficient protection during the prosecution stage.
- Legal Precedents:
- Vineet Narain vs Union of India (1998): The SC struck down the "Single Directive," an executive order requiring the CBI to obtain prior sanction of the designated authority before initiating investigation against certain categories of public servants.
- It ruled the directive created an arbitrary protected class and obstructed impartial probes, violating Article 14.
- Dr. Subramanian Swamy vs Director, CBI (2014): The SC struck down Section 6A of the DSPE Act, 1946, which mandated prior central government approval to investigate officers of Joint Secretary rank and above. It held the provision was an irrational classification and impeded independent investigation.
- Vineet Narain vs Union of India (1998): The SC struck down the "Single Directive," an executive order requiring the CBI to obtain prior sanction of the designated authority before initiating investigation against certain categories of public servants.
- Systemic Reforms Highlighted: The discussion underscores the need for complementary measures i.e., swift disposal of corruption cases to act as a deterrent, and imposing penalties for false and malicious complaints to prevent abuse.
Frequently Asked Questions (FAQs)
1. What is Section 17A of the Prevention of Corruption Act, 1988?
Section 17A requires prior approval from the appropriate government before initiating an investigation into alleged offences by public servants related to official decisions.
2. How does Section 17A differ from Section 19 of the PCA, 1988?
Section 17A operates at the investigation stage, while Section 19 mandates prior sanction before prosecution in a court of law.
3. Why was Section 17A introduced in 2018?
It was introduced to prevent the ‘play-it-safe syndrome’ by shielding officers from vexatious investigations for decisions made in good faith.
UPSC Civil Services Examination, Previous Year Questions (PYQs)
Q1. With reference to the ‘Prohibition of Benami Property Transactions Act, 1988 (PBPT Act)’, consider the following statements: (2017)
- A property transaction is not treated as a benami transaction if the owner of the property is not aware of the transaction.
- Properties held benami are liable for confiscation by the Government.
- The Act provides for three authorities for investigations but does not provide for any appellate mechanism.
Which of the statements given above is/are correct?
(a) 1 only
(b) 2 only
(c) 1 and 3 only
(d) 2 and 3 only
Ans: (b)


Important Facts For Prelims
One District One Product (ODOP)
Why in News?
The One District One Product (ODOP) initiative has recently been in the news for its nationwide expansion, highlighting its role in promoting district-level economic development and local entrepreneurship.
What is One District One Product (ODOP)?
- About: The One District One Product (ODOP) scheme is a flagship programme of the Ministry of Commerce and Industry, implemented through the Department for Promotion of Industry and Internal Trade (DPIIT) with support from Invest India.
- Inspired by Japan’s “One Village One Product” model, ODOP identifies, brands, and promotes one distinctive product from each district. As of 2025, it covers 1,102 products across 761 districts, including agriculture, handicrafts, textiles, and food items.
- Objective: The scheme aims to transform local specialities into global brands by supporting artisans, farmers, and small enterprises, while preserving India’s cultural heritage and traditional skills.
- Launched in Uttar Pradesh in 2018, starting with Moradabad’s brassware, the initiative helped revive traditional crafts such as chikankari embroidery, pottery, carpets, leather goods and brassware.
- Vision: ODOP aligns with Atmanirbhar Bharat and “Vocal for Local”, promoting sustainable production, innovation, and market access, with eco-friendly and traditionally crafted products positioned for international markets.
- Product Selection and Coverage: Products are selected by States and Union Territories based on existing local ecosystems and communicated to DPIIT.
- Currently, over 1,200 ODOP products across sectors like textiles, food processing, handicrafts, and minerals are listed on the official digital portal.
- Market Access and Digital Integration: ODOP products are linked to wider markets through platforms such as the Government e-Marketplace (GeM), ODOP Bazaar and state-level e-commerce portals, expanding sales and outreach.
- Exports and Global Recognition: ODOP strengthens India’s export ecosystem through alignment with Make in India, Vocal for Local, and Districts as Export Hub, while showcasing Indian products at international trade exhibitions and global platforms.
ODOP Wall
- The ODOP Wall serves as a curated display of district-specific indigenous products at platforms such as SARAS Aajeevika Stores, aimed at enhancing market access and visibility for rural artisans and women Self-Help Groups
PM Ekta Malls
- Developed under a Public–Private Partnership (PPP) model, these malls aim to transform local crafts into national cultural hubs and global market destinations, supporting self-reliant and culturally confident India.
- They are being developed with ₹5,000 crore interest-free support including at least ₹100 crore per State, with 29 Unity Malls approved across 27 States, to improve market access and income for artisans and local entrepreneurs.
- They will act as dedicated retail hubs to promote ODOP, Geographical Indication(GI)-tagged and handicraft products, with earmarked space for every State and Union Territory to showcase district-level specialities.
Frequently Asked Questions (FAQs)
1. What is ODOP?
ODOP (One District One Product) is a government initiative that promotes one unique product from each district to boost local livelihoods and regional development.
2. When was ODOP launched?
ODOP was launched in 2018 in Uttar Pradesh and later expanded to the national level.
3. What is the main objective of ODOP?
The main objective of ODOP is to unlock district-level economic potential by supporting local artisans and producers through branding, market access, and skill development.
UPSC Civil Services Examination Previous Year Questions (PYQs)
Prelims
Q. What is/are the recent policy initiative(s)of Government of India to promote the growth of manufacturing sector? (2012)
- Setting up of National Investment and Manufacturing Zones
- Providing the benefit of ‘single window clearance’
- Establishing the Technology Acquisition and Development Fund
Select the correct answer using the codes given below:
(a) 1 only
(b) 2 and 3 only
(c) 1 and 3 only
(d) 1, 2 and 3
Ans: (d)


Rapid Fire
Amendments to New Drugs and Clinical Trials Rules, 2019
The Union Ministry of Health and Family Welfare has notified significant amendments to the New Drugs and Clinical Trials (NDCT) Rules, 2019, aiming to simplify regulatory processes and accelerate pharmaceutical research under the Ease of Doing Business framework.
- Waiver of Test Licence: The requirement to obtain a test licence from Central Drugs Standard Control Organization (CDSCO) for non-commercial manufacture of small quantities of drugs for research, examination, or analysis has been replaced with a prior-intimation mechanism.
- The waiver does not apply to high-risk categories such as cytotoxic drugs, narcotic drugs, and psychotropic substances, which still require a licence.
- Reduced Timelines: The reform is expected to save 90 days in the drug development cycle.
- For categories still requiring a licence, the statutory processing time has been halved from 90 days to 45 days. The reforms will optimise utilisation of existing CDSCO manpower and improve regulatory efficiency.
- Ease for Clinical Studies: Prior permission for low-risk Bioavailability/Bioequivalence (BA/BE) studies has been removed, now studies can now commence via simple online intimation to CDSCO.
- Digital Integration: To ensure smooth implementation, dedicated online modules will be launched on the National Single Window System (NSWS) and the SUGAM portal (CDSCO e-governance platform), enabling transparent, paperless, and hassle-free submission of intimations.
- Jan Vishwas Siddhant: These trust-based reforms align with the government's Jan Vishwas principles, aiming to make India a global hub for pharmaceutical R&D.
| Read more: Drugs and Clinical Trials Rules, 2019 |


Rapid Fire
Tantya Mama and Bhil Tribe
Tantya Mama has been in the news after the Madhya Pradesh government announced plans to install a new metal statue of the revered tribal figure.
Tatya Mama
- About: He was a prominent tribal freedom fighter from the Bhil community, which constitutes about 40% of Madhya Pradesh's 1.53 crore tribal population (Tribals form 21% of MP's population, the highest in India).
- Period of Resistance: Actively resisted British colonial rule between 1878 and 1889, in the backdrop of post-1857 Revolt, revenue oppression and exploitation of tribal communities.
- Popular Image: Revered as the Indian Robin Hood for his actions of targeting wealthy landowners and British-aligned authorities, then redistributing resources to support the poor and oppressed tribal populations. He is affectionately called “Mama” (maternal uncle).
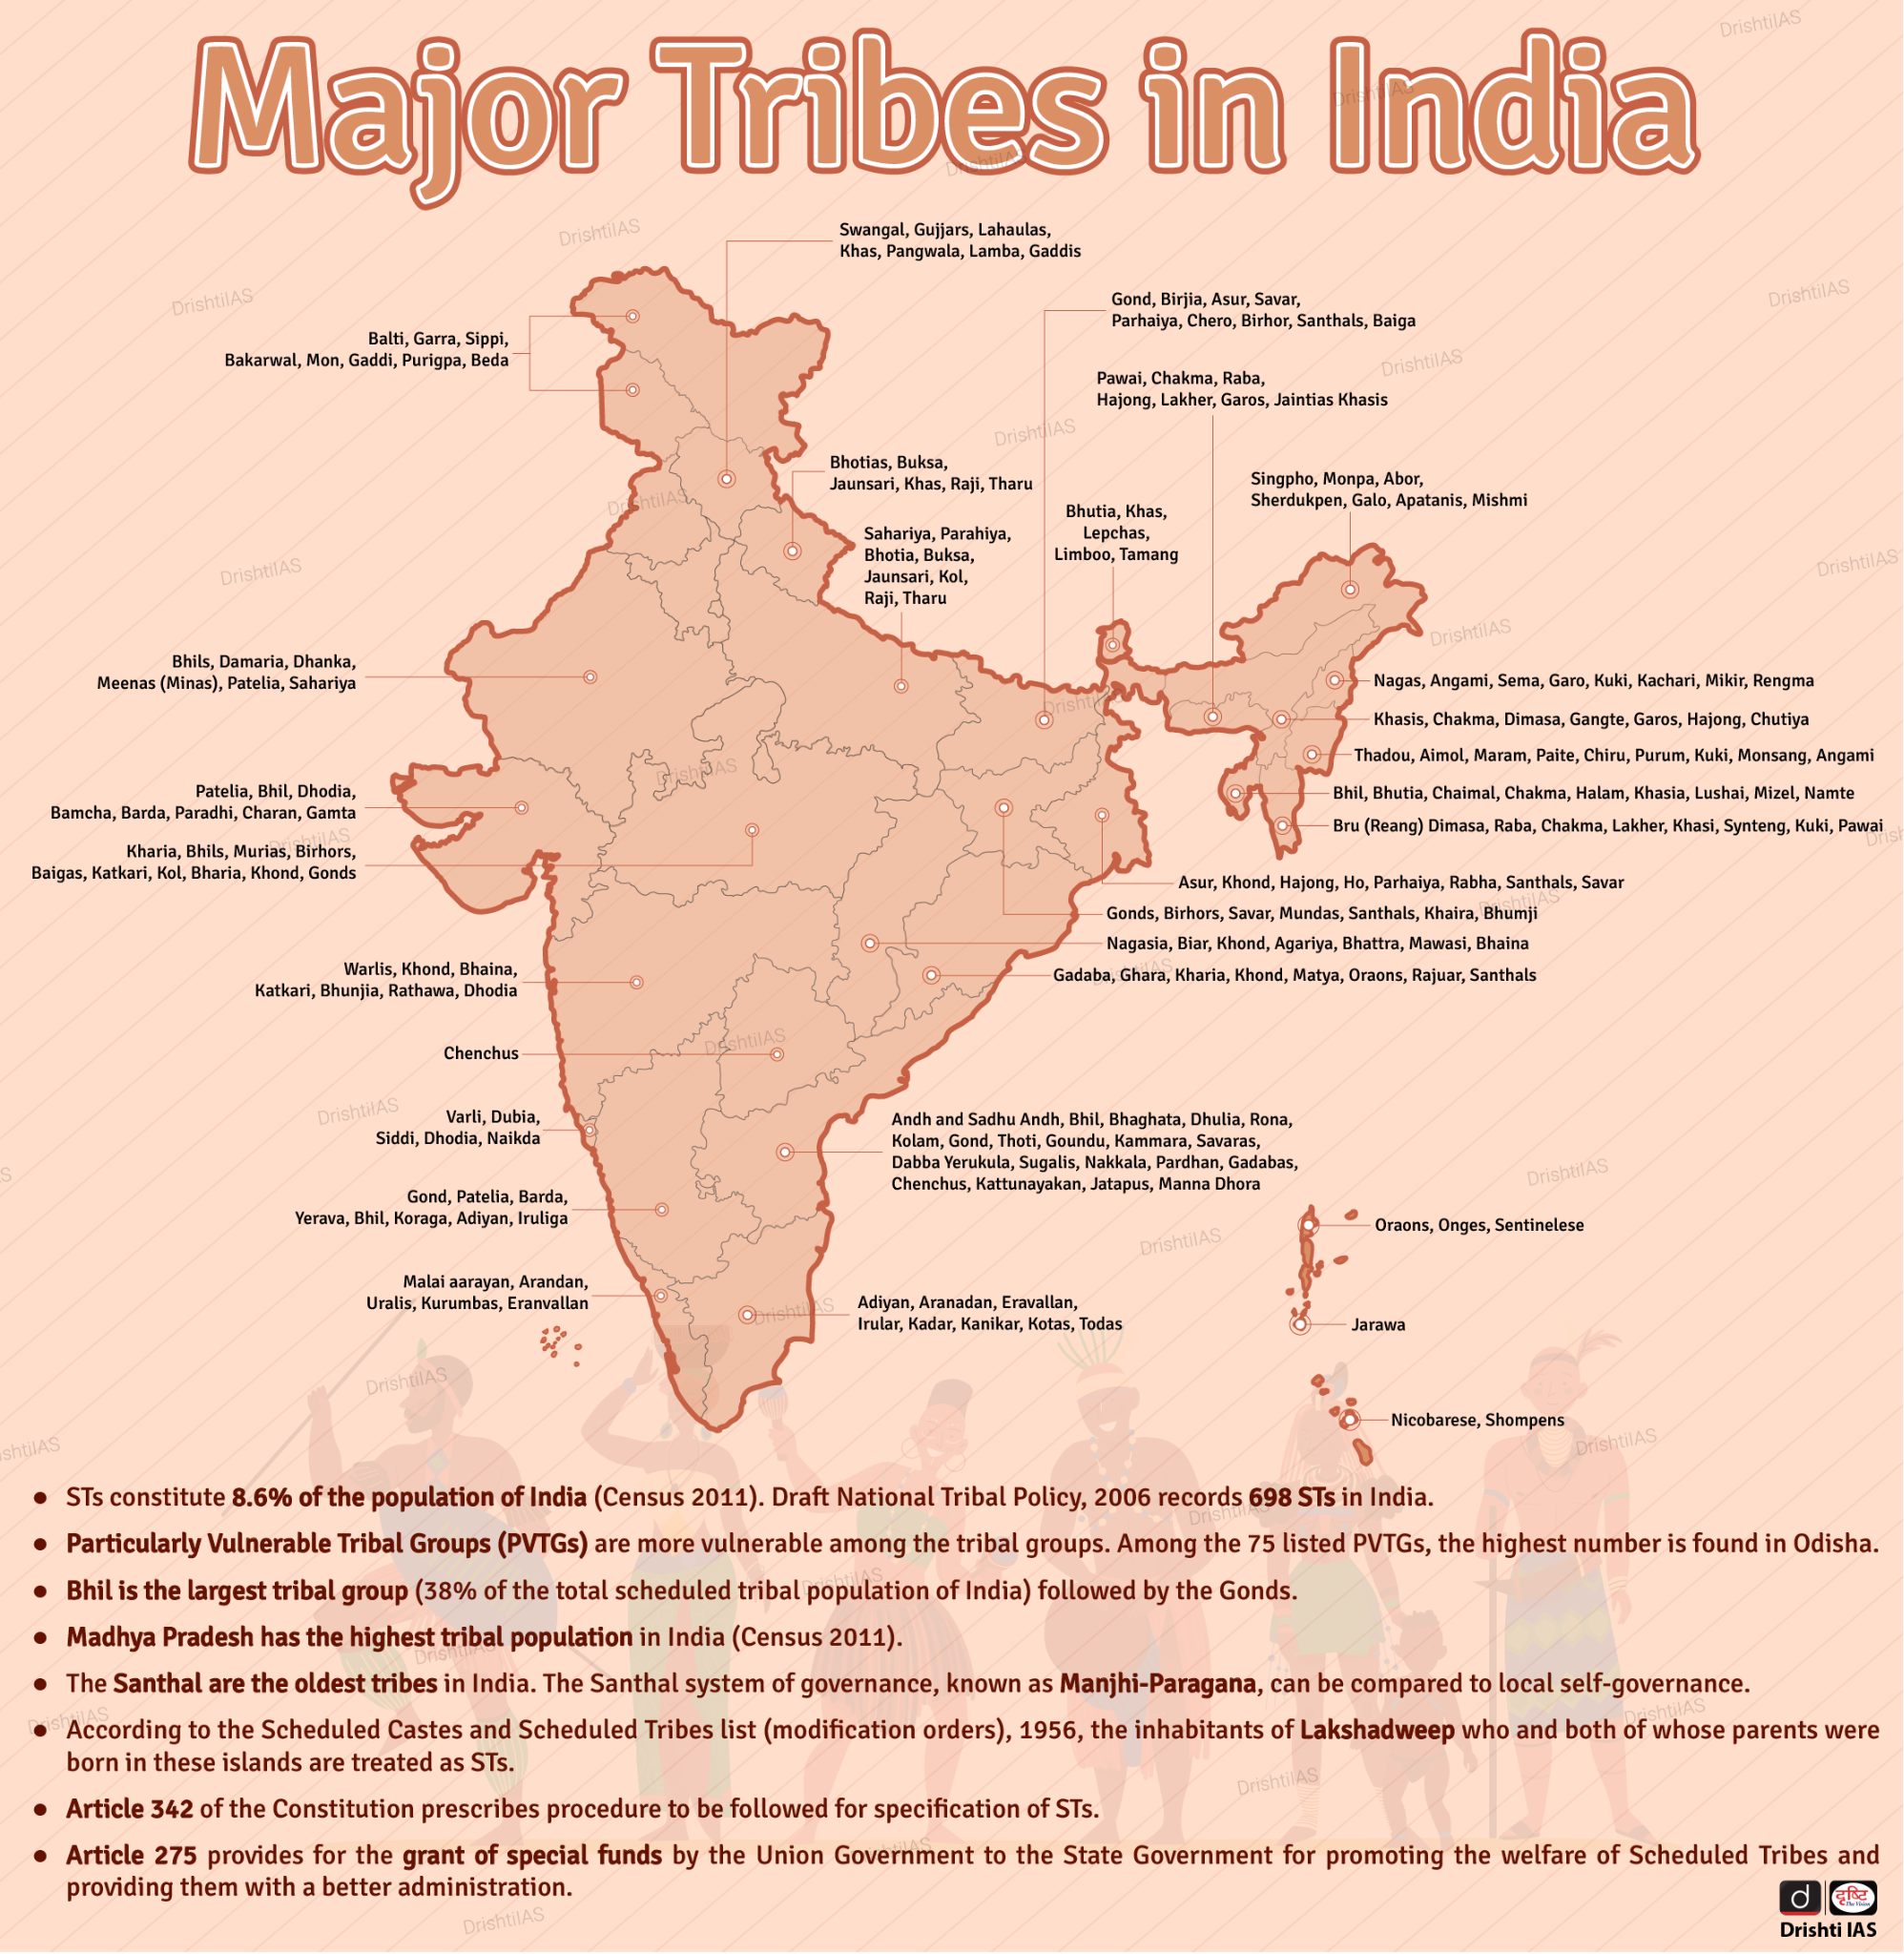
Bhil Tribe
- About: The Bhil are the largest tribal group in India (4.61 million, 37.7% of total ST population per 2011 Census), predominantly inhabiting across Gujarat, MP, Rajasthan, Maharashtra, Chhattisgarh, and Andhra Pradesh.
- Religious Practices: Predominantly Hindu with animistic elements; worship serpent gods, and nature deities. Some groups follow Islam (e.g., Nirdhi, Tadvi Bhils, Maharashtra).
- History of Colonial Resistance & Exploitation: Declared “Criminal Tribes” under the Criminal Tribes Act, 1871. Key revolts include:
- Bhagat Movement (1883) led by Govind Guru, culminating in the Mangarh massacre (1913,Adivasi Jallianwala).
- Eki Andolan (1920) led by Motilal Tejawat.
- Rich Cultural Heritage: Renowned for distinct art forms like Pithora paintings (MP) and Bhil art (dotted style), and festivals like Bhagoria (MP) and Gol Gadhedo (Gujarat).
| Read More: Janjatiya Gaurav Diwas to Commemorate Tribal Legacy |


Rapid Fire
Sound-Based Helium Leak Sensor
Researchers have developed a novel acoustic-based sensor using topological materials to detect helium leaks, a significant advancement given helium's chemical inertness, scarcity, and critical industrial applications.
- Innovative Mechanism: The sensor traps sound waves at its triangular corners using a Kagome lattice structure, enabling it to detect helium without a chemical reaction.
- Detection Principle: Helium changes the speed of sound in the sensor, altering the frequency of trapped sound waves; this shift is measured to calculate helium concentration instantly.
Helium
- About: Helium is a chemically inert noble gas that is colourless, odourless, tasteless, and non-toxic under standard conditions. It is the 2nd most abundant element in the universe after Hydrogen.
- Terrestrial Rarity & Origin: Rare in Earth's atmosphere; forms from alpha decay of radioactive elements (uranium, thorium) and is extracted as a byproduct of natural gas.
- Critical Applications: Essential for MRI scanners (cooling superconducting magnets), aerospace (rocket purging), leak detection, balloons and lifting (e.g., airships), breathing mixtures (deep-sea diving) and as a shielding gas in specialised welding (e.g., aluminium, titanium) that require high heat input and deeper penetration.
- Geopolitical & Supply Concerns: Faces a global shortage due to finite reserves, production constraints, and rising demand. India's Rajmahal volcanic basin (specifically Bakreswar-Tantloi geothermal area) is a potential domestic source, while the US, Algeria, and Russia hold major global reserves.
|
Read More: Tapping into Helium Reserves |


Rapid Fire
Thermogenesis in Sacred Lotus
- Recently, a study highlighted the unique ability of the sacred lotus (Nelumbo nucifera) to generate heat during flowering, a rare phenomenon among plants.
- About: The sacred lotus is native to North and Central India and grows in ponds, lakes and gently flowing water bodies. Flowering begins in early summer, with each flower lasting for three to four days.
- Thermogenesis: During its flowering phase, the lotus exhibits thermogenesis, the ability to produce heat, a trait also observed in plants such as skunk cabbage and arum lilies, primarily as an adaptation to enhance pollination.
- Key Thermal Feature: While blooming, the lotus flower maintains an internal temperature of about 30–35°C, even when the surrounding air temperature drops to nearly 10°C.
- Mechanism of Heat Production: Thermogenesis begins when the petals turn pink and the flower enters its female phase. A sharp increase in calcium ions in the pistil-bearing receptacle activates mitochondria, which use the alternative oxidase pathway to convert stored starch and fats directly into heat.
- Role in Pollination: The warm receptacle releases fragrance that attracts pollinating beetles. The petals close partially to form a warm chamber, and during the subsequent male phase, insects carry pollen to other flowers, enabling cross-pollination.
- Biological Significance: This heat production enhances pollination efficiency, promotes genetic diversity, and improves overall reproductive success of the plant.

| Read More: Revival of Lotus in Wular Lake |


