Indian Economy
Economic Survey 2025–26
- 30 Jan 2026
- 30 min read
For Prelims: Economic Survey, Chief Economic Adviser, Gross Fixed Capital Formation, Goods and Services Tax, SASCI, Non-performing Assets, Current account deficit, National Credit Framework, Samarth, Meri Panchayat
For Mains: India’s Economic Growth, Economic Survey, Fiscal Policy and Financial Stability, Challenges to Economic Growth.
Why in News?
The Union Minister for Finance and Corporate Affairs tabled the Economic Survey 2025–26 in Parliament, highlighting India’s resilience and positioning the economy as stable, investment-ready, and structurally strengthening amid global uncertainty.
Note: The Economic Survey is an annual government report presented before the Union Budget to assess India’s economic condition and outlook.
- It is prepared by the Economic Division of the Ministry of Finance under the Chief Economic Adviser, it reviews economic performance, sectoral trends, challenges, and prospects, and is tabled in both Houses of Parliament by the Union Finance Minister.
- First presented in 1950–51 as part of the Budget, it became a separate document in 1964.
What are the Key Highlights of the Economic Survey 2025–26?
State of the Economy
- Global growth is resilient but risks persist from geopolitics, trade fragmentation, and financial stress.
- The First Advance Estimates place Financial Year 2025-26 (FY26) Real GDP growth at 7.4% and Gross Value Added (GVA) growth at 7.3%. India retains strong growth momentum and is expected to grow by 6.8% – 7.2% in FY 2026 - 27, reaffirming its status as the fastest-growing major economy for the fourth consecutive year.
- Private Final Consumption Expenditure grew 7.0% in FY26, reaching 61.5% of GDP, the highest since 2012, supported by low inflation, stable employment, rising real incomes, strong rural demand from agriculture, and improved urban consumption due to tax rationalisation.
- Investment strengthened as Gross Fixed Capital Formation (GFCF) grew 7.8%, sustaining a 30% share of GDP, driven by public capex and reviving private investment.
- On the supply side, services remained the main growth driver, with services GVA at an estimated 9.1% growth for the full year.
Fiscal Developments
- Prudent fiscal management has strengthened India’s macroeconomic credibility. Centre’s revenue receipts rose from ~8.5% of GDP (FY16–20) to 9.2% in FY25 (PA), driven by higher non-corporate tax collections (~2.4% to ~3.3% of GDP).
- The direct tax base expanded, with income tax returns rising from 6.9 crore (FY22) to 9.2 crore (FY25).
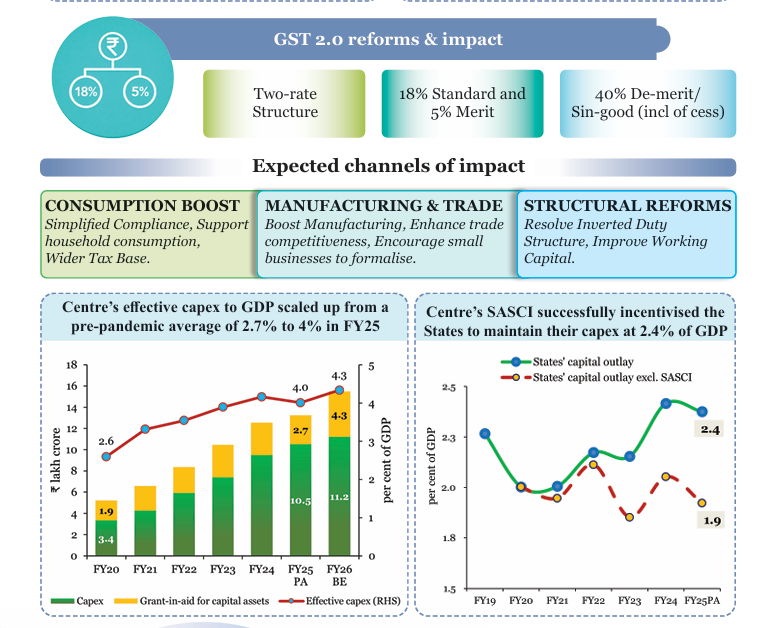
- Gross Goods and Services Tax (GST) collections during Apr–Dec 2025 stood at Rs 17.4 lakh crore (+6.7% YoY). GST 2.0 proposes a simplified two-rate structure to boost consumption, improve compliance, and enhance manufacturing competitiveness.
- Supporting this reform-led growth, the Centre’s effective capital expenditure (capex) rose from a pre-pandemic average of 2.7% of GDP to about 4% in FY25, while Special Assistance to States for Capital Expenditure (SASCI) successfully incentivised States to sustain capital outlay at ~2.4% of GDP, reinforcing public investment as a key demand and growth driver.
- State fiscal deficits edged up to 3.2% of GDP in FY25, even as India reduced its general government debt-to-GDP ratio by ~7.1% points since 2020 while maintaining high public investment.
Monetary Management & Financial Intermediation
- India’s monetary and financial sectors performed robustly in FY26 (Apr–Dec 2025).
- Banking sector asset quality improved significantly, with Gross Non-performing Assets (NPA) at 2.2% and net NPA at 0.5% in September 2025, while credit growth rose to 14.5% YoY by December 2025.
- Financial inclusion deepened, with Pradhan Mantri Jan Dhan Yojana (PMJDY) accounts reaching 55.02 crore, alongside expanded credit access through Stand-Up India, PM SVANidhi, and Pradhan Mantri Mudra Yojana (PMMY), which has disbursed Rs 36.18 lakh crore across 55.45 crore loan accounts.
- Capital market participation surged, with demat accounts exceeding 21.6 crore, 12 crore unique investors (nearly 25% women), and 5.9 crore mutual fund investors, increasingly from non-metro areas.
- Regulatory quality received global validation through the IMF–World Bank Financial Sector Assessment Program (FSAP) 2025, which highlighted a resilient and well-capitalised financial system, with total financial sector assets at ~187% of GDP and adequate buffers even under severe stress scenarios.
External Sector
- India’s external sector strengthened markedly, with its share in global merchandise exports rising from 1% to 1.8% and services exports from 2% to 4.3% between 2005 and 2024, alongside high trade partner diversification.
- UNCTAD’s Trade and Development Report 2025 ranks India third in the Global South for trade partner diversification, outperforming all Global North economies.
- India diversified crude oil imports in FY26, increasing shares from the US, UAE, Egypt, Libya, and Nigeria, while reducing reliance on Russia and West Asian suppliers.
- This aligns with India’s strategy to mitigate geopolitical risks.
- Total exports touched a record USD 825.3 bn in FY25 ( 6.1% YoY growth), driven by services exports at an all-time high of USD 387.6 bn ( 13.6% YoY growth ).
- In FY25, non-petroleum, non-gems and jewellery exports constituted nearly four-fifths of aggregate merchandise exports.
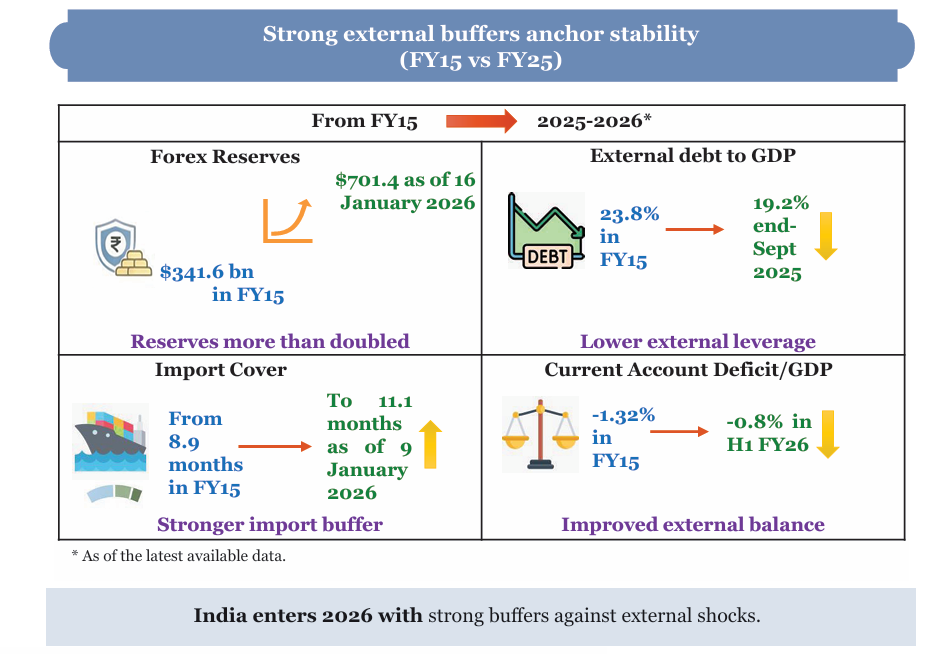
- The current account deficit (CAD) remained moderate (~1.3% of GDP in Q2 FY26), supported by strong services and record remittances of USD 135.4 bn, as forex reserves rose to USD 701.4 bn (11 months import cover).
- Despite a subdued global environment, India attracted USD 64.7 bn FDI (Apr–Nov 2025) and ranked 4th globally in Greenfield investments in 2024, emerging as the top destination for digital Greenfield projects during 2020–24.

Inflation
- India recorded its lowest-ever Consumer Price Index (CPI) inflation, with average headline inflation at 1.7% during Apr–Dec 2025, driven mainly by disinflation in food and fuel (52.7% of CPI basket).
- Among major Emerging Markets & Developing Economies (EMDEs), India saw one of the sharpest inflation declines.
Agriculture and Food Management
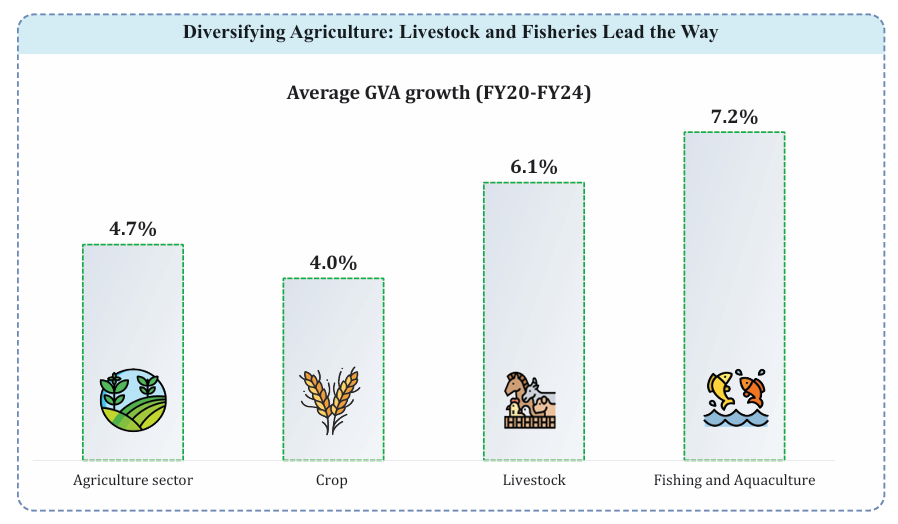
- India’s agriculture sector showed strong performance, with livestock GVA rising ~195% (FY15–FY24) and fish production increasing over 140% (2014–24).
- Supported by a good monsoon, foodgrain output reached a record 3,577.3 lakh metric tonnes (LMT) in AY 2024–25, while horticulture (33% of agri GVA) emerged as a key growth driver, surpassing foodgrains.
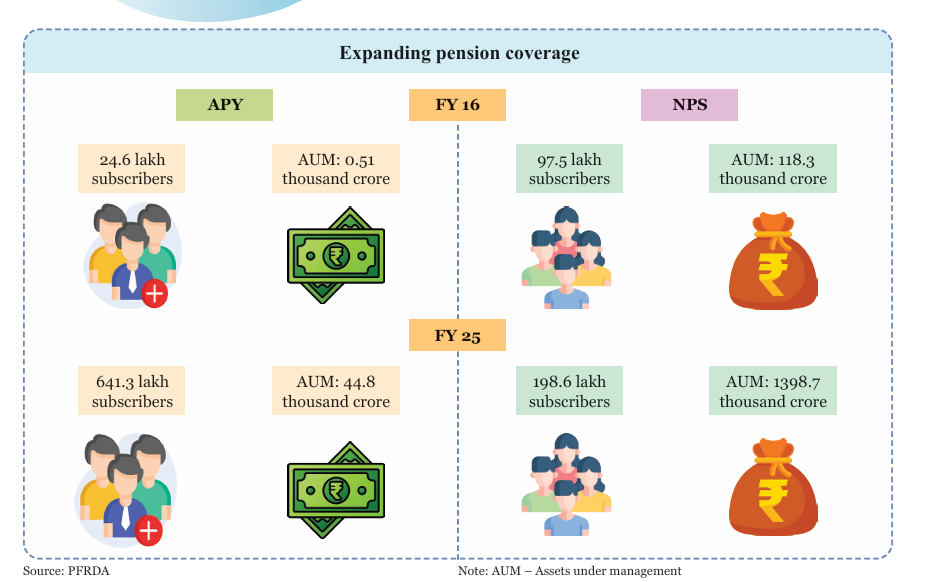
- Marketing and income support were strengthened through the Agriculture Infrastructure Fund (AIF), e-NAM, assured MSP, PM-KISAN and PM Kisan Maandhan Yojana (PMKMY) pension coverage, improving farm incomes and resilience.
Services
- India is the 7th-largest services exporter, with its global share rising from 2% (2005) to 4.3% (2024), and the services sector remains the largest FDI recipient, accounting for ~80% of total inflows in FY23–FY25.
- The services sector contributes significantly to employment, accounting for 30% of total jobs and 61.9% of urban employment.
- India has consolidated its position as a global technology and innovation hub, with expanding Global Capability Centres (GCCs).
- The country hosts the world’s third-largest technology startup ecosystem, with rapid scaling in GenAI startups, reflecting strong momentum in advanced digital and innovation-led sectors.
Industry’s Next Leap
- India ranks 12th globally in entrepreneurship policy and culture, 4th in trademarks, 6th in patents, and 7th in industrial designs (WIPO, 2024), reflecting a strengthening innovation ecosystem.
- It has also achieved a major critical technology breakthrough, placing among the top five globally in 45 of 64 critical technologies, up sharply from just four during 2003–07.
- India’s innovation ecosystem has strengthened steadily, with its Global Innovation Index rank improving from 81 (2015) to 38 (2025). DPIIT-recognised startups have grown rapidly to nearly 2 lakh by 2025.
- Patent applications nearly doubled between FY20–FY25, reflecting stronger innovation and IP activity.
- Production Linked Initiative (PLI) schemes attracted Rs 2.0 lakh crore investment, generated Rs 18.7 lakh crore output and 12.6 lakh jobs.
Investment and Infrastructure
- India’s infrastructure push intensified since FY18, with central capex rising 4.2 times from Rs 2.63 lakh crore (FY18) to Rs 11.21 lakh crore (FY26 BE) and effective capex at Rs 15.48 lakh crore (FY26 BE).
- Connectivity expanded FY14–FY26 through a 60% rise in national highway network,with near-100% rail electrification by Oct 2025, and India becoming the 3rd-largest domestic aviation market by 2025.
- National Highways network expanded from 91,287 km (FY14) to 1,46,572 km (FY26, up to Dec 2025), reflecting accelerated infrastructure build-out.
- Railway network length stands at 69,439 route km (as of March 2025), maintaining one of the world’s largest rail systems.
- Power demand–supply gap reduced sharply from 4.2% (FY14) to zero (Nov 2025), indicating near round-the-clock power availability.
- The power sector strengthened up to Nov 2025, with capacity reaching 509.74 GW, DISCOMs turning profitable in FY25.
- Tele-density reached 86.76%, and 5G services are now available in 99.9% of districts in the country.
- As of October 2025, over 81% of rural households have access to clean tap water under the Jal Jeevan Mission.
- India strengthened space infrastructure by becoming the fourth nation to achieve autonomous satellite docking (SpaDeX).
Environment and Climate Change
- As of December 2025, 38.61 GW of renewable capacity was added, led by 30.16 GW solar, 4.47 GW wind, 3.24 GW hydro, and 0.03 GW bio-power.
- The National Nuclear Energy Mission targets 5 indigenously designed Small Modular Reactors (SMRs) operational by 2033, expanding nuclear capacity from 8,780 MW to 100 GW by 2047, supported by the SHANTI Act 2025, which enables private participation.
- Environmental governance was streamlined via PARIVESH 3.0 single-window clearances, circular economy action plans.
Education and Health
- India is advancing towards universal access in education, targeting 100% Gross Enrolment Ratio (GER) in school education by 2030 and 50% GER in higher education by 2035.
- The school system covers ~25 crore students across 14.7 lakh schools with over 1 crore teachers, recording GERs of 90.9 (Grades I–V), 90.3 (VI–VIII), 78.7 (IX–X) and 58.4 (XI–XII).
- In higher education, 4.46 crore students are enrolled, with GER rising from 27.1 (2019–20) to 29.5 (2022–23).
- Higher education access expanded, alongside National Education Policy, 2020-led reforms such as National Credit Framework (NCrF) adoption, Academic Bank of Credit with APAAR (Automated Permanent Academic Account Registry) IDs with credits, and flexible entry–exit pathways in universities.
- India has made strong health gains, with maternal mortality rate (MMR) reduced by 86% since 1990, under- five mortality rate (U5MR) down 78%, and neonatal mortality rate (NMR) down 70%, all outperforming global averages.
- Infant Mortality Rate (IMR) fell by over 37%, from 40 (2013) to 25 (2023) deaths per thousand live births.
Employment and Skill Development
- India’s labour market remains resilient, with total employment at 56.2 crore (15+ age group) in Q2 FY26, reflecting net job creation of about 8.7 lakh over Q1 FY26 alongside economic expansion.
- Labour force participation rate rose from ~55% in April to ~56.1% by December, while unemployment stayed low at around 5% across Q1–Q2 FY26.
- Female labour force participation rate rose from 23.3% (2017–18) to 41.7% (2023–24), alongside a sharp decline in female unemployment from 5.6% to 3.2%, indicating stronger and more inclusive labour market outcomes.
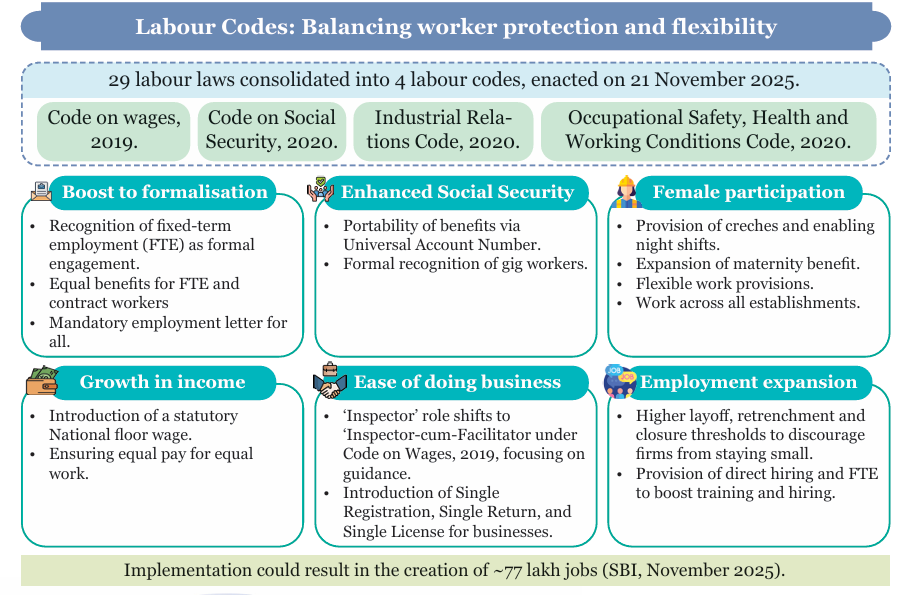
- Organised manufacturing employment rose 6% YoY in FY24 (over 10 lakh jobs), while Labour Codes expanded social security to gig and platform workers.
- e-Shram registered 31 crore unorganised workers (54% women), and the National Career Service connected 59 million job seekers with 5.3 million employers, mobilising ~80 million vacancies.
Rural Development and Social Progress
- Extreme poverty declined to 5.3% in 2022–23 under the revised USD 3.0/day poverty line of the World Bank. This progress has been supported by tech-driven rural initiatives such as SVAMITVA (mapping 3.28 lakh villages and issuing 2.76 crore property cards), Namo Drone Didi, and smart village models leveraging drones, solar power, and telemedicine.
- Participatory governance platforms like Samarth, Meri Panchayat, and eGramSwaraj have improved local planning and monitoring. Infrastructure expansion has ensured 99.6% rural connectivity, over 81% tap water coverage, and 2.9 crore houses constructed.
- Skill development and livelihoods were strengthened through DDU-GKY,and DAY-NRLM, with over 9 lakh community resource persons supporting women-led SHGs, food security, and stable rural incomes.
- The Survey justified scrapping MGNREGS, citing deep structural flaws and highlighted the Viksit Bharat Guarantee for Rozgar and Ajeevika Mission (Gramin) Act, 2025 as a comprehensive legislative reset.
Evolution of the AI Ecosystem in India
- India has strong AI fundamentals, with top-tier research output, a large talent pool, the 2nd most AI-literate workforce globally after the US, and vast yet underused domestic data across key sectors.
- Built on India’s ~1 billion connected users, the AI data framework balances openness, oversight, and domestic value creation through incentive-based compliance.
- It promotes local model training, domestic R&D funding, and upskilling to build sector-specific AI solutions for India’s development needs.
Urbanisation
- The Namo Bharat Regional Rapid Transit System (RRTS) shows how high-speed regional connectivity cuts travel time, expands job access, supports polycentric growth, and eases pressure on major cities.
- Waste management improved sharply, with door-to-door MSW collection covering 98% of urban wards and waste processing rising from 16% (2014–15) to 80% (2024–25).
Building Strategic Resilience and Strategic Indispensability
- The Survey calls for a shift from Strategic Resilience to Strategic Indispensability, urging India to move beyond defensive import substitution and become a critical node in global supply chains.
- It advocates intelligent, time-bound import substitution through a tiered indigenisation framework, while identifying state capacity as the key constraint—requiring an entrepreneurial state, regulatory experimentation, and protection for good-faith decision-making.
What are the Key Challenges Highlighted by the Economic Survey 2025–26?
- Global Uncertainty: The Survey highlights a shift from rules-based globalisation to geopolitical fragmentation, marked by strategic trade, supply-chain weaponisation, volatile capital flows, and rising resource nationalism (Pax Silica), making access to critical minerals, energy, technology, and finance increasingly uncertain.
- State Capacity as the Binding Constraint: India’s core challenge is weak state capacity, driven by bureaucratic risk aversion, fear of retrospective audits and vigilance inquiries, inability to reverse temporary policies (policy hysteresis), rather than mission-oriented governance.
- The Survey warns that the rapid expansion of unconditional cash transfers (Rs 1.7 lakh crore in FY26), though offering short-term relief, poses risks to fiscal sustainability and medium-term growth.
- It cautions that rising transfers crowd out productive capital expenditure, especially in revenue-deficit States.
- Competitiveness Issues: High energy, logistics, and raw-material costs act as an implicit tax on downstream manufacturing, weakening exports.
- The rupee remains structurally soft, backed by capital inflows instead of durable export surpluses, limiting external resilience.
- Low R&D: The private sector prioritises short-term profits and regulatory management over productivity-driven global competition.
- Underinvestment in R&D and frontier manufacturing and the absence of corporate stewardship of national productive capacity constrain long-term industrial capability.
- Societal Behavioural Constraints: A deficit of delayed gratification, shortcut-seeking behaviour, weak civic discipline, and neglect of the commons undermine reliable system-building and divert state capacity toward enforcement rather than development.
What Measures can Strengthen the Indian Economy?
- Manufacturing Push: Accelerate transition towards medium- and high-technology manufacturing, with strong momentum in electronics, EVs, pharmaceuticals, backed by PLI schemes.
- Agriculture Reorientation: Survey flags yield gaps versus global averages, calling for better seeds, crop diversification, and stronger extension services, FPO–PACS–SHG integration, and climate-resilient practices to boost productivity and sustainability.
- Infrastructure-led Investment: Sustain high public capex to crowd in private investment, supported by rapid expansion of highways, railways, ports, and logistics efficiency.
- Human Capital & Skilling: Align education and skills with industry needs through PMKVY 4.0, Skill Impact Bonds, apprenticeships, and NEP-led vocationalisation with flexible, credit-based learning pathways.
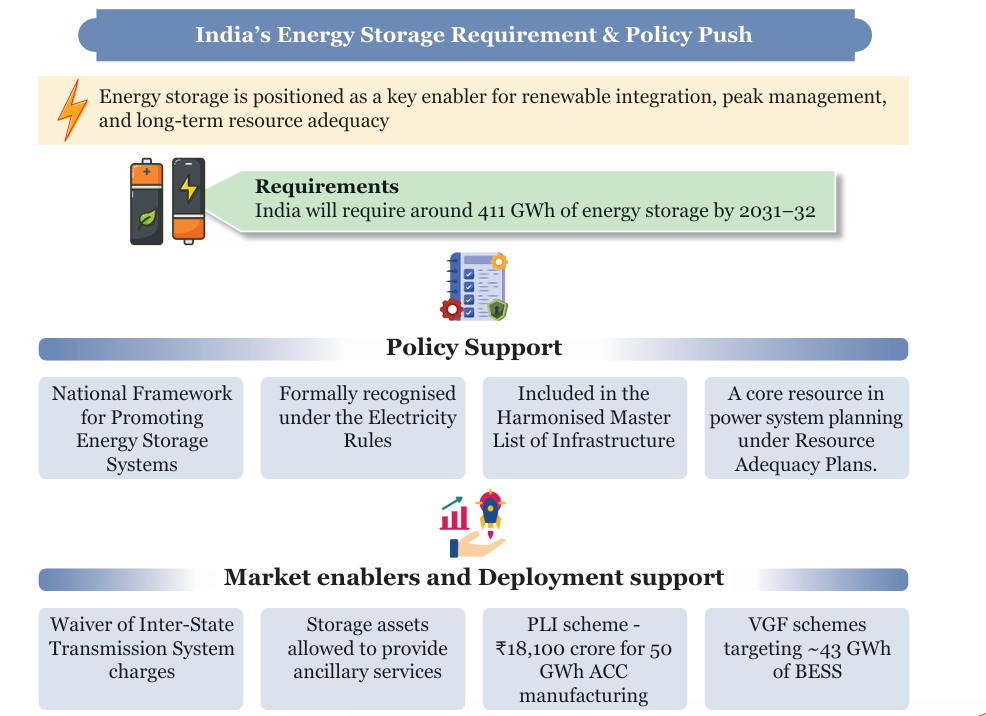
- Energy Transition & Sustainability: Advance the National Nuclear Energy Mission, scale battery energy storage, and deepen the circular economy through EPR and waste action plans.
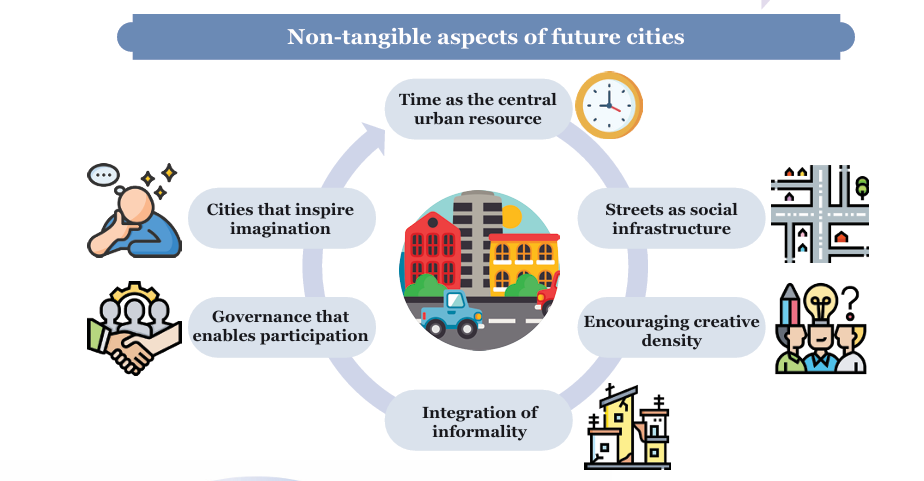
- Urban Transformation: Unlock urban productivity by increasing FSI, strengthening ULB finances, and expanding public transport (metros, e-buses) to address congestion and sprawl.
- AI & Digital Strategy: Adopt a “Frugal AI” approach focused on application-specific AI, supported by trusted cross-border data flows with domestic value retention, ensuring Indian data strengthens local innovation and R&D.
- Climate Strategy: The Survey advocates a growth-aligned climate strategy, prioritising adaptation over near-term mitigation and viewing development as a key form of resilience.
- It cautions against rapid, infrastructure-blind energy transitions, citing grid stresses in Europe, and stresses the need for innovation, institutional capacity, and reliable non-fossil energy such as nuclear power.
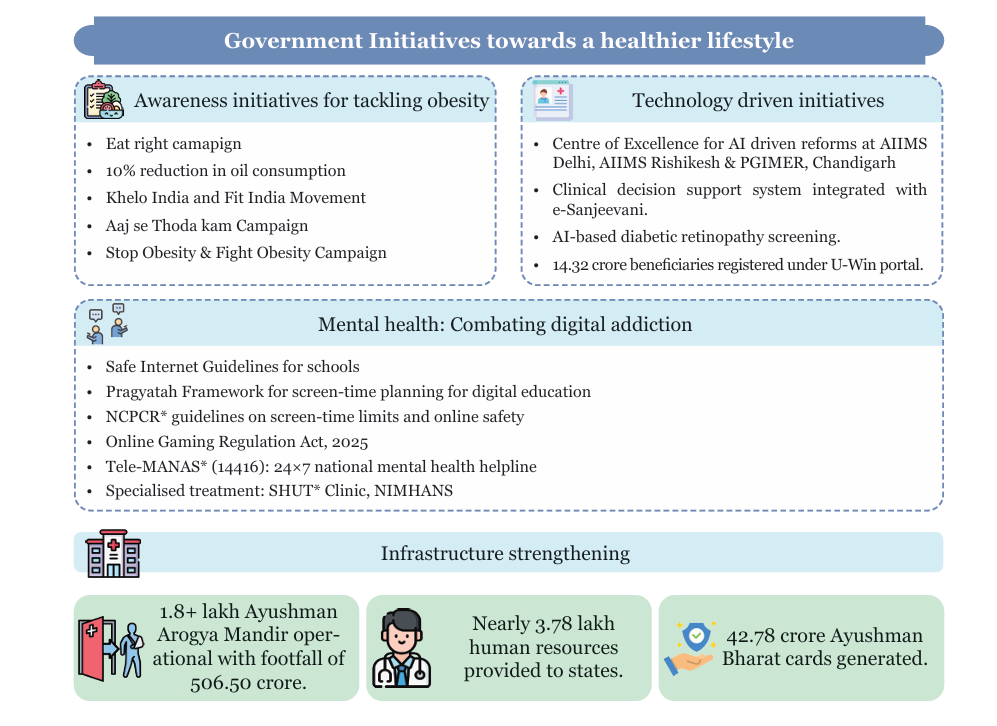
- Mental Health: The Survey flags digital addiction and screen-related mental health risks, especially among children, and calls for preventive, school-linked measures and expansion of Tele-MANAS beyond crisis care.
Conclusion
The Economic Survey 2025–26 projects India not merely as a resilient economy but as a rising anchor in the global order, transitioning from "Strategic Resilience" to "Strategic Indispensability." While macroeconomic fundamentals remain robust, India’s journey to becoming a developed nation will depend on aligning policy intent with execution, ensuring that growth is durable, inclusive, and deeply integrated into global value chains.
|
Drishti Mains Question: Analyse how India’s shift from Strategic Resilience to Strategic Indispensability reshapes its approach to global value chains and industrial policy |
Frequently Asked Questions
1. What is the Economic Survey?
The Economic Survey is an annual flagship document of the Government of India that reviews the state of the economy, sectoral trends, challenges, and prospects ahead of the Union Budget.
2. Who prepares and presents the Economic Survey?
It is prepared by the Economic Division of the Ministry of Finance under the Chief Economic Adviser (CEA) and tabled in Parliament by the Union Finance Minister.
3. When is the Economic Survey presented in Parliament?
It is usually presentedone day before the Union Budget in both Houses of Parliament.
4. When was the Economic Survey first introduced?
The Survey was first presented in 1950–51 as part of the Budget and became a separate document in 1964.
5. What are the core objectives of the Economic Survey?
To assess macroeconomic performance, analyse sectoral developments, identify structural challenges, and provide a forward-looking economic outlook.
6. How is the Economic Survey different from the Union Budget?
The Survey isanalytical and diagnostic, while the Budget is fiscal and policy-oriented, announcing taxes, expenditure, and allocations.
7. Which areas are typically covered in the Economic Survey?
Growth, inflation, fiscal policy, monetary sector, external sector, agriculture, industry, services, infrastructure, social sector, environment, and emerging issues likeAI and climate change.
UPSC Civil Services Examination, Previous Year Question (PYQ)
Prelims:
Q. Along with the Budget, the Finance Minister also places other documents before the Parliament which include ‘The Macro Economic Framework Statement’. The aforesaid document is presented because this is mandated by(2020)
(a) Long standing parliamentary convention
(b) Article 112 and Article 110(1) of the Constitution of India
(c) Article 113 of the Constitution of India
(d) Provisions of the Fiscal Responsibility and Budget Management Act, 2003
Ans: (d)
Mains:
Q. Distinguish between Capital Budget and Revenue Budget. Explain the components of both these Budgets.(2021)
Do you agree that the Indian economy has recently experienced a V- shapes recovery? Give reasons in support of your answer.(2021)
Q. “Industrial growth rate has lagged behind in the overall growth of Gross-Domestic-Product(GDP) in the post-reform period” Give reasons. How far are the recent changes in Industrial Policy capable of increasing the industrial growth rate? (2017)


