Indian Economy
India’s Income Mobility
For Prelims: Income Mobility, World Inequality Report 2026, K-shaped Recovery , National Education Policy, 2020, Emergency Credit Line Guarantee Scheme
For Mains: Inclusive Growth And Income Inequality In India ,Human Capital Formation
Why in News?
India’s income mobility trends (2014–2025) reveal a worrying shift, with more households falling down the income ladder than moving up.
- The pattern challenges claims of inclusive growth and highlights rising economic vulnerability across rural areas, caste groups, and religious communities, underscoring mobility as a key measure of inequality.
Summary
- India’s income mobility trends (2014–2025) show more households falling than rising, with rural areas, SCs, OBCs, and vulnerable religious groups facing the sharpest declines due to inequality, informal sector distress, and uneven post-Covid recovery.
- Strengthening rural livelihoods, MSMEs, education, and social inclusion—along with schemes like PM-KUSUM, MUDRA, PLI, Skill India, and Stand-Up India—is essential to reverse downward mobility and ensure growth translates into broad-based economics.
What are the Key Trends in India’s Income Mobility?
- Doubling of Downward Mobility: The share of households experiencing downward mobility nearly doubled, jumping from 14% in 2015 to 26.8% in 2025.
- By the end of 2025, more than 1 in 4 Indian households were worse off than they were in 2014.
- Lagging Upward Mobility: While upward mobility did increase (from 14.1% to 23.5%), it consistently trails the rate of downward movement.
- Shrinking Middle: The proportion of households remaining in their original income tier fell sharply from over 70% to under 50%.
- Rural Vulnerability: In 2025, nearly 29% of rural households slid down the income ladder compared to their 2014 standing.
- Upward movement in villages has been consistently outpaced by downward slips.
- Urban Concentration of Gains: Urban India fared better, experiencing upward mobility at a faster pace than rural areas.
- Despite better overall performance, downward mobility also rose in urban centers, pointing to widespread economic insecurity rather than broad-based inclusion.
- Role of Caste in Shaping Economic Mobility: Caste continues to be a decisive factor in economic mobility, reflecting long-standing structural inequalities and unequal access to opportunities.
- Downward mobility rose across all social groups, with particularly sharp spikes among Other Backward Classes (OBC) and Scheduled Caste (SC) households.
- For SC households, upward mobility remained highly muted and uneven across the entire 2014-2025 period, contradicting claims of expanding opportunities.
- Scheduled Tribes (ST) showed comparatively lower downward mobility and occasional stronger upward movement, likely reflecting the impact of regional development efforts and targeted interventions.
- Religious Groups: Downward mobility increased for all religious groups, but the rise was most pronounced among Hindu and Muslim households.
- Sikh and Christian households experienced stronger upward mobility in the early years of the decade, but this momentum weakened significantly in the latter half.
Note: Income mobility refers to the movement of households between income groups over time. It can be upward mobility (moving to a higher income group), downward mobility (falling to a lower group), or no change.
- The concept is important because it captures dynamic inequality rather than static poverty, indicates whether economic growth creates opportunities or vulnerabilities, and reflects the overall health, stability, and resilience of a society.
What are the Causes for Downward Shift in India’s Income Mobility?
- Rising Income Inequality: According to the World Inequality Report 2026, the top 10% of earners capture a disproportionate 58% of the national income. In contrast, the bottom 50% of the population receives only 15%.
- The richest 10% hold around 65% of the nation's total wealth. The top 1% alone hold about 40% of total wealth.
- High inequality reduces mobility by limiting access to capital, networks, and quality education.
- Long-term Impact of Covid-19: India’s post-pandemic recovery has been uneven, with growth concentrated in tech and finance while tourism, retail, and hospitality workers faced lasting income losses.
- This K-shaped recovery widened inequality and accelerated downward mobility among low-income households.
- Neglect of the Informal Sector and MSMEs: India’s workforce remains overwhelmingly informal (about 80–85%), yet policy support for agriculture, small industries, and street-level enterprises has been fragmented.
- MSMEs, which contribute roughly 30% of GDP and employ over 11 crore people, continue to face credit constraints, delayed payments, and weak demand after Covid-19.
- This has reduced stable jobs and living wages, increasing downward income mobility among semi-skilled workers.
- Educational Inequality: Unequal access to quality higher education limits entry into high-productivity sectors.
- With only 4 Indian universities in the top 500 universities worldwide (Times Higher Education World University Rankings 2026) and rising reliance on contractual faculty in state universities, teaching quality has weakened for non-elite students, deepening skill gaps and restricting upward mobility.
- Caste-based Deprivation: Historical hierarchies continued to dictate economic outcomes.
- Occupational segmentation, unequal access to assets, and entrenched social discrimination disproportionately drove downward mobility for marginalized groups, particularly among SCs and OBCs.
- Urban-centric Growth: Economic expansion is concentrated in metropolitan hubs such as Bengaluru, Hyderabad, and Gurugram, driven by real estate, IT, and high-end services.
- In contrast, rural regions face stagnant farm incomes, climate shocks, and volatile crop prices, widening regional inequality and pushing rural families toward downward mobility.
What Measures can Accelerate India’s Upward Income Mobility?
- Strengthen Rural Livelihoods: Expanding schemes such as PM-KUSUM, promoting Farmer Producer Organizations (FPOs), and investing through the Agriculture Infrastructure Fund can stabilise farm incomes and diversify rural livelihoods.
- These measures reduce income volatility and prevent rural households from slipping into poverty.
- Boost MSMEs And Informal Sector Formalisation: Improving credit access via Pradhan Mantri MUDRA Yojana and Emergency Credit Line Guarantee Scheme (ECLGS), along with formalisation through Udyam Registration, can strengthen small businesses.
- A resilient MSME sector generates stable employment and supports upward income mobility.
- Create Employment Through Labour-Intensive Manufacturing: Leveraging the Production Linked Incentive (PLI) Scheme, Make in India, and PM MITRA Parks can expand job-rich sectors like textiles, food processing, and electronics assembly.
- Employment-intensive growth ensures that economic expansion translates into mass upward mobility.
- Improve Education Quality And Skill Development: Expanding Skill India Mission, and strengthening PMKVY can bridge skill gaps.
- Quality education under National Education Policy, 2020 and industry-linked training enable disadvantaged groups to access high-productivity jobs.
- Promote Inclusive Growth: Scholarships under the Post-Matric Scholarship Scheme and entrepreneurship support through Stand-Up India and the National SC/ST Hub can reduce structural barriers.
- Inclusive policies expand opportunities and improve mobility among historically disadvantaged groups.
- Increase Women’s Labour Force Participation: Programmes such as DAY-NRLM and Pradhan Mantri Matru Vandana Yojana support women’s economic participation.
- Higher female workforce participation significantly improves household incomes and promotes upward social mobility.
- According to the International Monetary Fund, increasing women’s participation in the labour force could raise India’s GDP by nearly 27%, highlighting its major economic and social benefits.
Conclusion
As Charles Dickens observed, “It was the best of times; it was the worst of times.” India’s growth story reflects this duality (remarkable progress alongside deep inequality) and the path forward lies in ensuring that opportunity rises faster than vulnerability.
|
Drishti Mains Question: Examine the structural factors responsible for rising downward mobility in India despite sustained GDP growth. |
Frequently Asked Questions (FAQs)
1. What is income mobility and why is it important?
Income mobility refers to movement across income groups over time; it measures dynamic inequality and indicates whether growth creates opportunity or vulnerability.
2. What does the rise in downward mobility indicate about India’s economy?
It signals rising inequality, rural distress, and weak job creation, showing that growth has not translated into broad-based prosperity.
3. How do MSMEs influence income mobility in India?
MSMEs employ over 11 crore people and contribute ~30% of GDP; their distress reduces stable jobs and increases downward mobility.
4. Why is educational inequality a barrier to upward mobility?
Limited access to quality higher education and skill training prevents entry into high-productivity sectors, deepening income gaps.
5. Which schemes support upward income mobility in India?
PM-KUSUM, MUDRA Yojana, PLI Scheme, NEP 2020, Skill India Mission, Stand-Up India, and DAY-NRLM promote jobs, skills, and inclusive growth.
UPSC Civil Services Examination, Previous Year Question (PYQ)
Prelims
Q. Inclusive growth as enunciated in the Eleventh Five Year Plan does not include one of the following: (2010)
(a) Reduction of poverty
(b) Extension of employment opportunities
(c) Strengthening of capital market
(d) Reduction of gender inequality
Ans: (c)
Mains
Q. Inequality in the ownership pattern of resources is one of the major causes of poverty. Discuss in the context of ‘paradox of poverty’. (2025)
Q. COVID-19 pandemic accelerated class inequalities and poverty in India. Comment. (2020)


Social Issues
From Population Explosion to Population Stabilisation
For Prelims: National Family Health Surveys (NFHS), Replacement Level, Total Fertility Rate, United Nations Population Fund's (UNFPA).
For Mains: Key facts regarding the transition in fertility rate in India, key factors driving low fertility rate in India, implications of low fertility rate in India and measures required to achieve sustainable population growth.
Why in News?
India has undergone a remarkable fertility transition over the last 25 years, with successive National Family Health Surveys (NFHS) revealing a shift from a high-fertility developing nation to one where most states have reached or fallen below the replacement level of 2.1.
- This trend has effectively diffused the once-dominant "Population Bomb" thesis by Paul and Anne Ehrlich, which assumed rapid fertility would outpace economic growth and strain public services in India.
Summary
- India has transitioned to sub-replacement fertility, with NFHS-5 reporting a TFR of 2.0, reflecting major demographic change.
- Drivers include female education, urbanisation, contraceptive access, and shifting social norms.
- While it offers a demographic dividend, challenges such as ageing population, workforce decline, and regional disparities require strategic policy responses.
What are the Key Facts Regarding the Transition in Fertility Rate in India?
- Historical Context: India's TFR (Total Fertility Rate) was consistently high in the 1950s–1970s, peaking near 6 children per woman in the early 1960s. The decline began steadily from the 1970s onwards due to family planning initiatives and socio-economic changes.
- By 2000, the TFR had fallen to approximately 3.5 children per woman, reflecting continued progress through the 1980s and 1990s.
- NFHS-5 Benchmark: The NFHS-5 (2019–21) reported a national TFR of 2.0, marking the first time India fell below the replacement level of 2.1 at the national level.
- Current Estimates (Mid-2020s): As of 2023–2025, India's TFR is widely estimated to be around 1.9 births per woman, confirming a sustained period of sub-replacement fertility.
- Regional Variations Persist: Despite national achievement, significant variation remains. Southern states (like Kerala and Tamil Nadu) and urban areas have TFRs as low as 1.4–1.8, while some northern states (like Bihar and Uttar Pradesh) are still approaching replacement level.
- Future Projection: India's population is expected to peak around 1.7–1.9 billion by the 2060s–2080s before stabilizing or slowly declining.
What are the Key Factors Driving Low Fertility Rate in India?
- Female Education as Primary Driver: The single most important correlate of lower fertility is female education. NFHS-5 data shows women with 12+ years of schooling have a TFR of 1.8, compared to 2.8 for those with no schooling, as educated women delay marriage, prioritize careers, and exercise greater reproductive autonomy.
- Urban-Rural Divide: Urban TFR (~1.6) is significantly lower than rural TFR (~2.1), driven by higher living costs, career focus, smaller living spaces, and changing lifestyles in cities that discourage large families.
- Economic Pressures as Barriers: Recent United Nations Population Fund's (UNFPA) State of World Population 2025 highlight that financial strain, job insecurity (~21%), housing issues (~22%), and lack of affordable childcare (~18%) are major barriers, causing couples to desire fewer children or delay parenthood despite wanting more.
- Contraceptive Access: India's long-standing family planning programs have resulted in a contraceptive prevalence rate of ~67%, enabling effective birth spacing and reducing unintended pregnancies.
- Weakening Son Preference: The traditional cultural preference for sons—driven by patrilineal inheritance and old-age security—is weakening due to increased education, changing gender stereotypes, and girls being seen as economic assets, reducing pressure for repeated childbirths.
- Social Norm Shifts: Attitudes now favor "quality over quantity" in parenting, with families investing more in fewer children's education and future, supported by reduced infant mortality (89 per 1000 live births in 1990 to 25 per 1000 live births in 2023) and better healthcare/savings reducing dependence on children for old-age support.
What are the Implications of Low Fertility Rate in India?
|
Positive |
Concerns/Risks |
|
Demographic Dividend: Larger working-age population (15–59 years) relative to dependents, boosting economic growth through higher workforce participation, savings, and investment in education and human capital. |
Aging Population: Rapid rise in elderly share (projected ~20% by 2050), leading to higher old-age dependency ratio and strain on healthcare, pensions, and social security systems. |
|
Reduced Pressure on Resources: Lower population growth eases strain on land, water, food, infrastructure, and the environment (less depletion and climate impact). |
Shrinking Workforce: Future labor shortages as fewer young people enter the job market, potentially slowing GDP growth and innovation if not managed. |
|
Improved Social Equity & Services: Slower population growth enables better access to education, healthcare, and public services, reducing regional disparities and allowing quality-over-quantity investments in children. |
Loss of Demographic Dividend Window: Without skills development, job creation, and aging policies, the demographic advantage may fade (similar to challenges seen in Japan and China). |
|
Opportunity for "Silver Economy" Growth: An aging population creates new market opportunities. There will be increased demand for healthcare, assisted living facilities, leisure travel for seniors, and financial products tailored for retirees. |
Getting Old Before Getting Rich: India may age faster than it becomes wealthy, risking inadequate elderly care, rising social inequities, and fiscal burdens without strong safety nets. |
|
Health and Reproductive Outcomes: Lower fertility correlates with improvements in women's reproductive health indicators, including better access to family planning, reduced health risks from frequent childbearing, and overall enhanced well-being in contexts of improved healthcare availability. |
Sandwich Generation Burden: The working-age population (15–59 years) will face the double burden of raising their own children (who are expensive to educate) while also caring for their aging parents, leading to financial and emotional stress. |
What Measures are Required to Achieve Sustainable Population Growth?
- Human Capital Investment: With fewer children per family, economic output per individual must rise. This requires fixing the foundational learning crisis through the National Education Policy (NEP), 2020, skilling youth for future jobs (AI, green energy), and investing in preventive healthcare (e.g., Mission Indradhanush) to ensure a healthy, productive workforce.
- Pro-Family Economic Environment: The government must reduce the cost of raising children to stop birth rates from falling too low. This requires better childcare (Anganwadi 2.0), paid parental leave for both parents, and tax breaks, especially for the middle class.
- Prepare for the Silver Economy: As the population ages, India needs new infrastructure, including universal pension coverage for the unorganized sector, geriatric healthcare specialization (improving the quality of life for older adults), and age-accessible urban design.
- Manage Internal Migration: Fertility decline is uneven (Bihar ~2.98 vs. Kerala ~1.7). The government should facilitate internal mobility from high-fertility to low-fertility states to fill labor shortages and create policies for the smooth integration of migrants.
Conclusion
India’s transition to sub-replacement fertility marks a major demographic shift with opportunities for a demographic dividend and sustainable development. However, emerging challenges like population aging, shrinking workforce, and regional fertility disparities require proactive policies focusing on human capital development, social security expansion, and balanced population management.
|
Drishti Mains Question: "India's Total Fertility Rate (TFR) has fallen below the replacement level, yet this presents both an opportunity and a challenge." Discuss. |
Frequently Asked Questions (FAQs)
1. What is the replacement level of fertility?
Replacement level fertility (2.1 children per woman) is the fertility rate at which a population exactly replaces itself from one generation to the next without migration.
2. What is India’s current Total Fertility Rate (TFR)?
According to NFHS-5 (2019–21), India’s TFR declined to 2.0, and recent estimates (2023–2025) suggest it is around 1.9 births per woman, indicating sub-replacement fertility.
3. What is the demographic dividend?
It refers to the economic growth potential resulting from a larger working-age population (15–59 years) compared to dependents, enabling higher productivity, savings, and investment.
4. Why is female education important for reducing fertility rates?
Higher female education delays marriage, increases workforce participation, improves reproductive autonomy, and leads to smaller family size preferences.
5. What is the ‘Silver Economy’?
The Silver Economy refers to economic opportunities arising from an ageing population, including sectors like geriatric healthcare, retirement services, assisted living, and financial products for seniors.
UPSC Civil Services Examination, Previous Year Questions (PYQs)
Prelims
Q. Consider the following specific stages of demographic transition associated with economic development:(2012)
- Low birthrate with low death rate
- High birthrate with high death rate
- High birthrate with low death rate
Select the correct order of the above stages using the codes given below:
(a) 1, 2, 3
(b) 2, 1, 3
(c) 2, 3, 1
(d) 3, 2, 1
Ans: (c)
Q. Consider the following statements with reference to Indira Gandhi National Old Age Pension Scheme (IGNOAPS): (2008)
- All persons of 60 years or above belonging to the households below poverty line in rural areas are eligible.
- The Central Assistance under this Scheme is at the rate of `300 per month per beneficiary. Under the Scheme, States have been urged to give matching amounts.
Which of the statements given above is/are correct?
(a) 1 only
(b) 2 only
(c) Both 1 and 2
(d) Neither 1 nor 2
Ans: (d)
Mains
Q. What is the concept of a ‘demographic winter’? Is the world moving towards such a situation? Elaborate. (2024)
Q. Discuss the main objectives of Population Education and point out the measures to achieve them in India in detail. (2021)


Important Facts For Prelims
India Submits 7th National Report to the CBD
Why in News?
India has submitted its 7th National Report to the Convention on Biological Diversity (CBD), providing a comprehensive assessment of the country's progress toward the 23 national biodiversity targets (NBT) and 142 indicators aligned with the Kunming-Montreal Global Biodiversity Framework (KMGBF).
- Of the 23 national biodiversity targets, only two are on track. The report outlines policies for the rest, but lacks quantitative evidence or clear projections for 2030.
What are the Key Facts Regarding the 7th National Report to the Convention on Biological Diversity?
- About: This is India's first full progress assessment since the adoption of the KMGBF in 2022, serving as a crucial "reality check" on the nation's commitment to halting biodiversity loss by 2030.
- Preparation and Scope: Prepared by the Union Ministry of Environment, Forest and Climate Change (MoEFCC) with inputs from 33 central ministries, Wildlife Institute of India, the National Biodiversity Authority, and technical support from the United Nations Development Programme (UNDP).
- Report Significance: As one of the world's megadiverse countries, India's performance is critical to global biodiversity outcomes. The report's data will feed into international assessments tracking progress toward the KMGBF's 23 global targets, which include the "30x30" goal (conserving 30% of land and sea by 2030).
- Targets On Track: Progress is tracked using 142 national indicators compiled through a digital NR7 data portal.
- NBT1 (Biodiversity-inclusive planning): Steady progress with forest and tree cover now at 25.17% (827,357 sq km), an increase of 1,445.81 sq km between 2021 and 2023. Wetland inventories completed, PARIVESH 2.0 portal streamlined environmental approvals, and eco-sensitive zones notified.
- NBT2 (Ecosystem Restoration): India has restored/placed under restoration 24.1 million hectares against its Bonn Challenge pledge of 26 million hectares.
- India’s forest carbon stock rose by about 81.5 million tonnes to 7,285.5 million tonnes, while mangrove cover increased modestly and bamboo area expanded by 1,540 sq km.
- Marine protected areas have expanded, and the government is now identifying Other Effective Area-Based Conservation Measures (OECMs) beyond the formal protected area network.
- Critical Challenges and Concerns:
- Land Degradation: Despite restoration efforts, 29.77% (97 million hectares) of India's geographical area is undergoing degradation, suggesting new degradation may be outpacing restoration.
- Conservation Coverage (30x30 Goal): Only a little over 5% of India's geographical area is designated as formal protected areas. The report does not clarify if India will reach the global 30% conservation target by 2030.
- Species Recovery Bias: Success is highlighted for flagship species (tigers at 3,167, Asiatic lions, rhinos, and the first national snow leopard assessment). However, data on lesser-known species is limited.
- Data Gaps and Monitoring: Biodiversity data is scattered across departments with no uniform methods for new indicators. Different collection intervals and rapid technological changes make long-term trend comparisons difficult.
- Financial and Technical Capacity: The report points to limited financial resources and technical capacity as structural hurdles, along with the growing impact of climate change (floods, droughts, forest fires) on ecosystems.
- Agriculture and Invasive Species: While agroforestry covers 8.65% of the country, the report lacks quantitative analysis on critical issues like pesticide reduction, nutrient runoff, and control of invasive species, which are major drivers of biodiversity loss.
Kunming-Montreal Global Biodiversity Framework
- About: KMGBF is a landmark international agreement adopted at Conference of the Parties (COP15) to the UN Convention on Biological Diversity (CBD) in December 2022.
- Its goal is to halt and reverse biodiversity loss by 2030 and achieve living in harmony with nature by 2050. It replaces the earlier Aichi Biodiversity Targets (2011-2020).
- Structure of the Framework: It is built around four long-term goals for 2050 (vision for living in harmony with nature) and 23 action-oriented targets for 2030 (the "global milestones"), covering critical areas like ecosystem conservation, sustainable use, and benefit-sharing.
- The "30x30" Target (Target 3): It aims to ensure that at least 30% of the world's terrestrial, inland water, and coastal and marine areas are effectively conserved and managed through protected areas and Other Effective Area-based Conservation Measures (OECMs) by 2030. This is a significant increase from the current global coverage of around 16%.
- Implementation Mechanism: All parties to the CBD, including India, are required to set and implement national targets aligned with the GBF, update their National Biodiversity Strategies and Action Plans (NBSAPs), and establish robust monitoring systems to track progress.
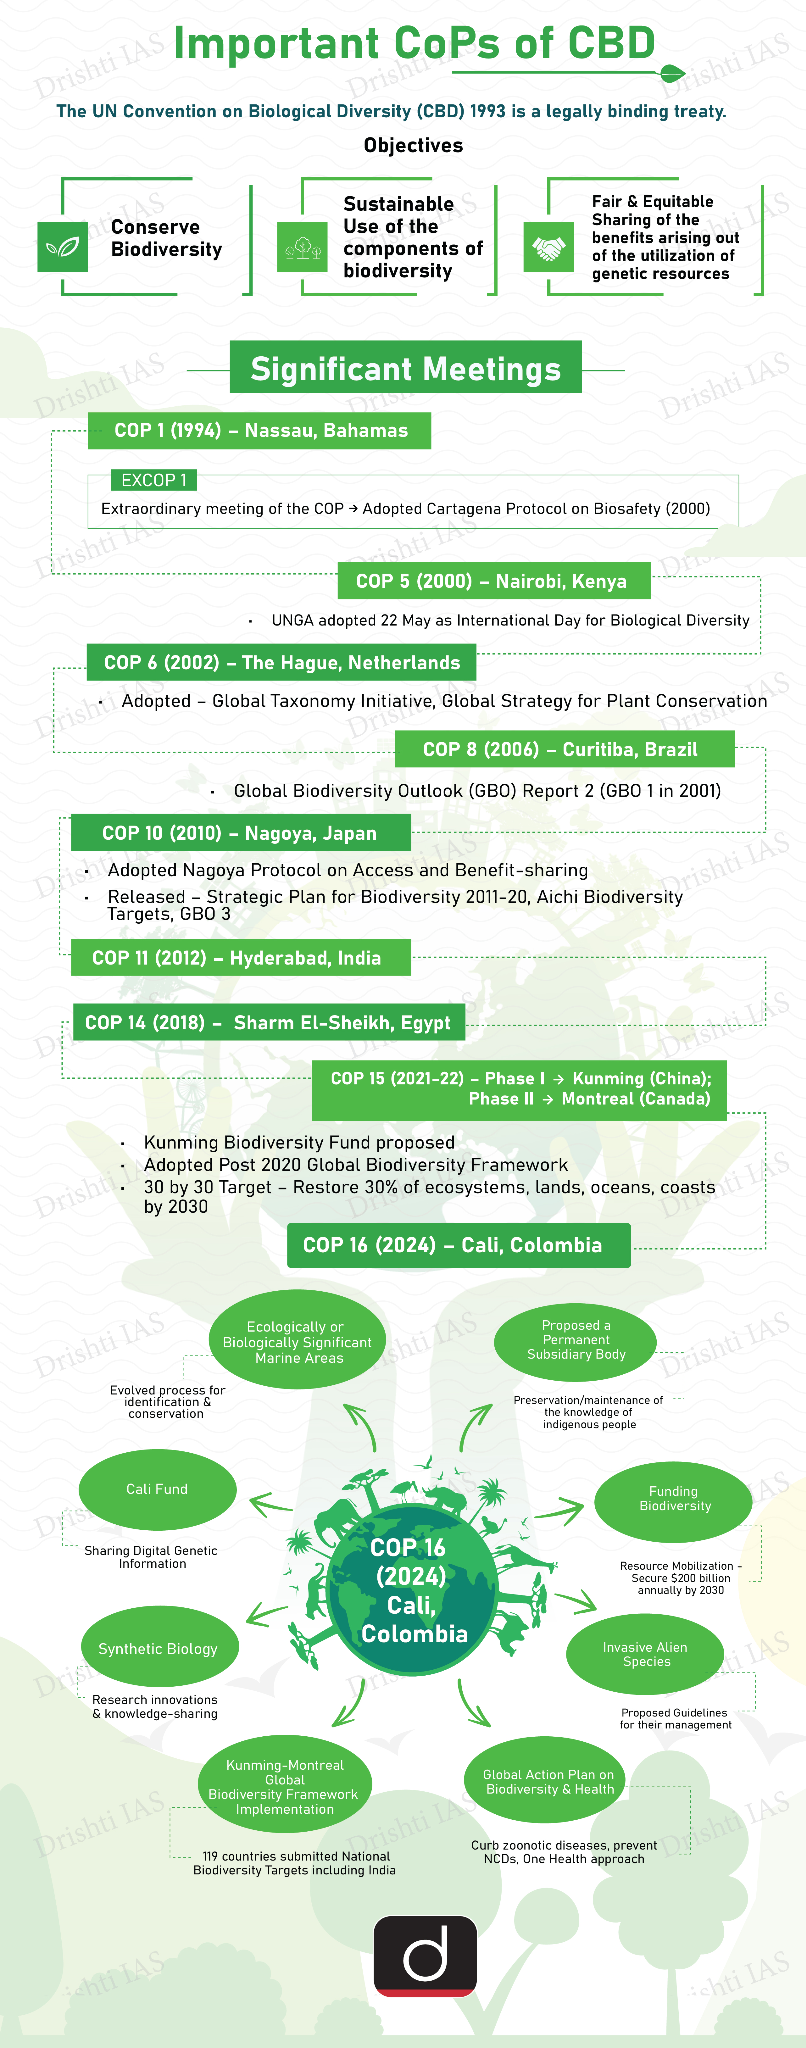
Convention on Biological Diversity
- About: The Convention on Biological Diversity (CBD) is a landmark international treaty originating from the 1992 Rio Earth Summit that provides the primary global framework for conserving and sustainably using biological resources.
- Three Core Objectives: The CBD is founded on three interconnected goals:
- Conservation of biological diversity,
- Sustainable use of its components, and
- Fair and equitable sharing of benefits arising from genetic resources.
- Comprehensive Scope: The Convention covers biodiversity at all levels i.e., diversity within species (genetic), between species, and of ecosystems. It applies to terrestrial, marine, and other aquatic ecosystems.
- Key Supplementary Protocols:
- Cartagena Protocol on Biosafety (2000): Focuses on the safe handling, transport, and use of Living Modified Organisms (LMOs) resulting from modern biotechnology.
- Nagoya Protocol on Access and Benefit-Sharing (2010): Provides a legal framework for the fair and equitable sharing of benefits arising from the utilization of genetic resources, thereby operationalizing the third objective of the CBD.
Frequently Asked Questions (FAQs)
1. What is the Kunming–Montreal Global Biodiversity Framework (KMGBF)?
It is a global agreement adopted at CBD COP15 (2022) to halt and reverse biodiversity loss by 2030, built around 23 targets for 2030 and four long-term goals for 2050.
2. What is the “30x30 Target” under the KMGBF?
It aims to conserve at least 30% of the world’s land, inland waters, and marine areas by 2030 through protected areas and Other Effective Area-based Conservation Measures (OECMs).
3. Which biodiversity targets are currently on track in India according to the 7th National Report?
NBT1 (Biodiversity-inclusive land and sea-use planning) and NBT2 (Ecosystem restoration) are identified as being on track among the 23 national biodiversity targets.
UPSC Civil Services Examination Previous Year Question (PYQ)
Q. With reference to ‘Global Environment Facility’, which of the following statements is/are correct? (2014)
(a) It serves as financial mechanism for ‘Convention on Biological Diversity’ and ‘United Nations Framework Convention on Climate Change’
(b) It undertakes scientific research on environmental issues at global level
(c) It is an agency under OECD to facilitate the transfer of technology and funds to underdeveloped countries with specific aim to protect their environment
(d) Both (a) and (b)
Ans: (a)
Q.“Momentum for Change: Climate Neutral Now” is an initiative launched by (2018)
(a) The Intergovernmental Panel on Climate Change
(b) The UNEP Secretariat
(c) The UNFCCC Secretariat
(d) The World Meteorological Organisation
Ans: (c)


Important Facts For Prelims
Air Pollution in India
Why in News?
An analysis by the Centre for Research on Energy and Clean Air (CREA), a Finland-based independent research group, found that 204 out of 238 Indian cities failed to meet national air quality standards during winter 2025–26.
- The analysis used data from the Central Pollution Control Board (CPCB) collected through Continuous Ambient Air Quality Monitoring Stations (CAAQMS), and the findings highlight the severity of winter air pollution across India.
What are the Key Findings of the CREA Analysis?
- Widespread National Non-Compliance: During the winter period, 204 out of 238 cities recorded average PM2.5 levels exceeding the Indian National Ambient Air Quality Standard (NAAQS) of 40 µg/m³.
- Not a single city out of the 238 analyzed managed to meet the World Health Organization’s (WHO) safe PM2.5 standard of 5 µg/m³.
- Most Polluted Cities: Ghaziabad emerged as the most polluted city in the country with an average PM2.5 concentration of 172 µg/m³. It was closely followed by Noida (166 µg/m³) and Delhi (163 µg/m³).
- The majority of India's economic hubs struggled with toxic air. Delhi (163 µg/m³), Kolkata (78 µg/m³), Mumbai (48 µg/m³), and Chennai (44 µg/m³) all recorded winter PM2.5 concentrations above the national standard.
- Cleanest Cities: Chamarajanagar in Karnataka was recorded as the cleanest city in India during the winter season, boasting an average PM2.5 concentration of just 19 µg/m³.
- Bengaluru was the only megacity to keep its air quality slightly below the NAAQS limit, recording an average PM2.5 concentration of 39 µg/m³.
- Southern and Central/Northeastern India performed the best. The ten cleanest cities included eight from Karnataka, one from Madhya Pradesh, and one from Meghalaya.
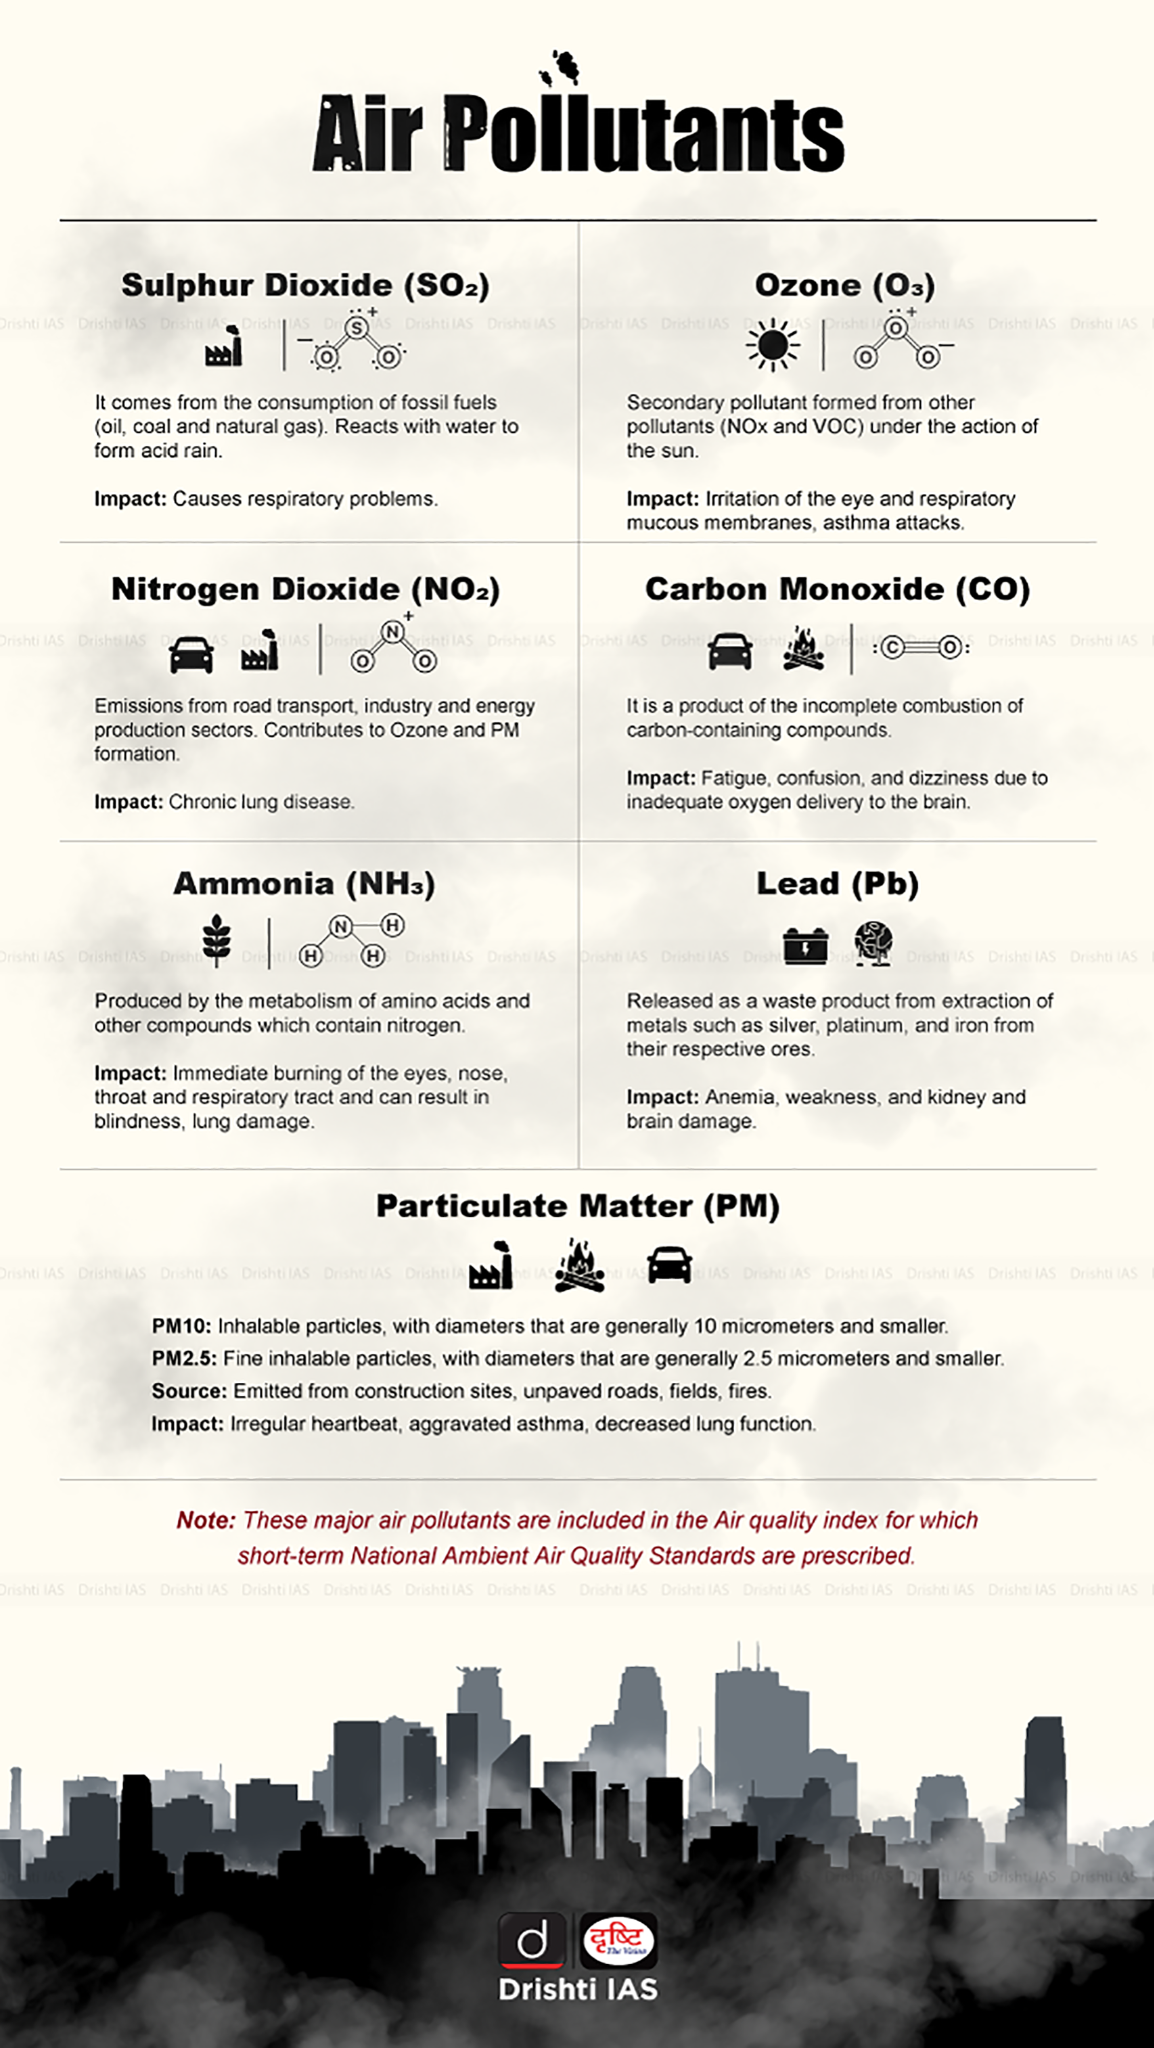
Key Terms Related to Air Pollution
Core Pollutants
- Particulate Matter (PM10 & PM2.5): Microscopic solid or liquid matter suspended in the atmosphere.
- PM10 particles have a diameter of 10 micrometers or less. PM2.5 are incredibly fine particles (2.5 micrometers or less) that can penetrate the lung barrier and enter the bloodstream.
- Ground-Level (Tropospheric) Ozone (O3): Unlike stratospheric ozone (which protects us from UV rays), ground-level ozone is a harmful secondary pollutant.
- It is not emitted directly but is created by chemical reactions between oxides of nitrogen (NOx) and volatile organic compounds (VOCs) in the presence of sunlight.
- Volatile Organic Compounds (VOCs): Organic chemicals that easily become vapors or gases at room temperature.
- They are emitted from paints, solvents, vehicle exhaust, and industrial processes, and play a major role in smog formation.
- Secondary Pollutants: Pollutants not directly emitted from a source but formed in the lower atmosphere by chemical reactions among primary pollutants (e.g., ground-level ozone, photochemical smog).
Atmospheric Phenomena
- Photochemical Smog: A brownish-gray haze caused by the action of solar ultraviolet radiation on an atmosphere polluted with hydrocarbons and oxides of nitrogen.
- It is a common problem in heavily motorized cities with warm, sunny climates.
- Temperature Inversion (Thermal Inversion): The temperature inversion occurs when air temperature increases with altitude instead of decreasing, creating a warm layer above cooler air that traps pollutants near the ground.
- In winter, Delhi’s cold conditions cause pollutants to accumulate in the lower atmosphere, forming dense smog and worsening surface-level air pollution.
- Acid Rain: Precipitation containing harmful amounts of nitric and sulfuric acids, formed primarily by nitrogen oxides and sulfur dioxide released into the atmosphere from burning fossil fuels.
Monitoring & Measurement
- Air Quality Index (AQI): A color-coded tool for effective communication of air quality status to people.
- In India, the National AQI calculates an overall index based on the concentrations of 8 pollutants (PM10, PM2.5, NO2, SO2, CO, O3, NH3, and Pb).
- NAAQS (National Ambient Air Quality Standards): Standards prescribed by the CPCB for ambient air quality.
- In India, NAAQS covers 12 pollutants (the 8 in AQI plus Benzene, Benzo(a)Pyrene, Arsenic, and Nickel).
- SAFAR (System of Air Quality and Weather Forecasting and Research): An initiative by the Ministry of Earth Sciences (MoES) to provide location-specific information on air quality in near real-time and its forecast 1-3 days in advance.
- CAAQMS (Continuous Ambient Air Quality Monitoring Stations): Highly advanced, automated stations that continuously measure air pollutants and transmit data in real-time to central servers (used to calculate the daily AQI).
Governance & Action Frameworks
- GRAP (Graded Response Action Plan): An emergency set of anti-pollution measures implemented in the Delhi-NCR region.
- The measures under GRAP are "graded" and kick in incrementally as the AQI deteriorates (from "Poor" to "Severe+").
- Bharat Stage (BS) Emission Standards: BS Emission norms instituted by the Government of India to regulate the output of air pollutants from internal combustion engines and motor vehicles.
- India is currently following BS-VI norms.
- NCAP (National Clean Air Programme): A national-level strategy launched by the Ministry of Environment, Forest and Climate Change (MoEFCC) to tackle air pollution comprehensively across the country, targeting a 20-30% reduction in particulate matter concentrations by 2024 (later revised to a 40% reduction by 2026).
Frequently Asked Questions (FAQs)
1. What is PM2.5 and why is it dangerous?
PM2.5 refers to particulate matter with a diameter of2.5 micrometers or less, which can penetrate deep into the lungs and bloodstream, causing respiratory and cardiovascular diseases.
2. What is the Air Quality Index (AQI)?
TheAir Quality Index (AQI) is a color-coded tool used in India to communicate air quality levels, calculated based on the concentration of eight major pollutants.
3. What is Temperature Inversion and how does it affect air pollution?
Temperature inversion occurs whenwarmer air sits above cooler air near the ground, trapping pollutants and causing severe smog, especially during winter in northern India.
4. What is the objective of the National Clean Air Programme?
NCAP aims toreduce particulate matter pollution by up to 40% by 2026 through city-specific action plans, monitoring expansion, and coordinated pollution control measures.
5. What is the Graded Response Action Plan?
GRAP is anemergency pollution control framework for Delhi-NCR, where restrictions are implemented progressively as AQI levels worsen.
UPSC Civil Services Examination, Previous Year Question (PYQ)
Prelims
Q. Artificial way of causing rainfall to reduce air pollution makes use of (2025)
a) silver iodide and potassium iodide
b) silver nitrate and potassium iodide
c) silver iodide and potassium nitrate
d) silver nitrate and potassium chloride
Ans: (a)
Q. How is the National Green Tribunal (NGT) different from the Central Pollution Control Board (CPCB)? (2018)
- The NGT has been established by an Act whereas the CPCB has been created by an executive order of the Government.
- The NGT provides environmental justice and helps reduce the burden of litigation in the higher courts whereas the CPCB promotes cleanliness of streams and wells, and aims to improve the quality of air in the country.
Which of the statements given above is/are correct?
(a) 1 only
(b) 2 only
(c) Both 1 and 2
(d) Neither 1 nor 2
Ans: (b)
Mains
Q. Describe the key points of the revised Global Air Quality Guidelines (AQGs) recently released by the World Health Organisation (WHO). How are these different from its last update in 2005? What changes in India’s National Clean Air Programme are required to achieve revised standards?(2021)


Rapid Fire
Denmark Eliminates Mother-to-Child Transmission of HIV and Syphilis
Denmark has been certified by the World Health Organization (WHO) as the first country in the European Union to eliminate mother-to-child transmission (EMTCT) of HIV and syphilis.
- Elimination of MTCT: Mother-to-Child Transmission (MTCT) is the spread of infections like HIV and syphilis from a mother to her baby during pregnancy, childbirth, or breastfeeding, which without intervention can lead to infant infections, stillbirths, neonatal deaths, or congenital diseases.
- Criteria of MTCT Elimination: WHO's criteria for EMTCT include reducing mother-to-child transmission rates to below 50 per 100,000 live births and ensuring over 95% of pregnant women receive testing and treatment.
- Global Context: Denmark joins over 20 countries and territories worldwide validated by WHO for EMTCT or progressing toward certification. These include nations in the Caribbean (e.g., Anguilla, Antigua), South America (e.g., Brazil), Africa (e.g., Botswana), and Asia (Malaysia, Maldives).
- WHO’s Triple Elimination Strategy: WHO promotes triple elimination of HIV, syphilis, and Hepatitis B through four pillars:
- Universal antenatal care
- Integrated maternal infection testing
- Effective treatment protocols
- Strong health systems with community engagement and human-rights protections.
- HIV: Human Immunodeficiency Virus (HIV) attacks the body's immune system, specifically CD4 cells. If untreated, it leads to Acquired Immunodeficiency Syndrome (AIDS), making the body vulnerable to life-threatening infections and cancers.
- Syphilis: Syphilis is a bacterial infection caused by Treponema pallidum. It spreads via sexual contact, progressing through stages: painless sores, rashes, and potentially severe damage to the heart and brain if untreated.
| Read More: World AIDS Day 2025 |


Rapid Fire
Karnataka and Andhra Pradesh Plan Social Media Ban for Minors
Announcements by Karnataka and Andhra Pradesh to ban social media for minors have sparked a constitutional debate, as regulating the internet fundamentally falls under the exclusive jurisdiction of the Union Government.
- State Initiative: Karnataka (restricting users under 16) and Andhra Pradesh (restricting users under 13) are attempting to curb the negative psychological impacts of online platforms on children.
- Union's Exclusive Domain: Under the 7th Schedule of the Indian Constitution, telecommunications and internet regulation fall squarely under the Union List (Entry 31: Posts and telegraphs, telephones, wireless, broadcasting and other like forms of communication).
- Consequently, India’s digital space is governed by Central legislation, primarily the Information Technology Act, 2000.
- Measures that directly dictate terms to digital intermediaries traditionally require action from the Union Government.
- Due to the architecture of the internet, implementing a state-specific ban is practically difficult to enforce without the cooperation of the Union Government, which controls the gateways and Internet Service Providers.
- Potential State Justification: States might attempt to justify these bans by invoking subjects under the State or Concurrent Lists, such as "Public Order," "Public Health," or "Child Welfare."
- Fundamental Rights vs. Reasonable Restrictions: Digital rights advocates argue that blanket bans violate a child's Freedom of Speech and Expression (Article 19(1)(a)) and Right to Information.
- Any restriction must strictly qualify as a "reasonable restriction" under Article 19(2) and must be proportionate.
- Global Precedents: This localized debate mirrors a global trend, with Australia becoming the first nation to enact a nationwide social media ban for children, and Indonesia announcing similar regulations for users under 16.
| Read more: Social Media Regulation for Children |
Rapid Fire
Megalithic Laterite Rock-Cut Chamber Unearthed in Kerala
A significant Megalithic laterite rock-cut chamber has been discovered in Kasaragod district, Kerala, offering fresh insights into the prehistoric burial practices and material culture of the region.
- The chamber is part of a Megalithic culture burial complex that was constructed by interring pottery of varying shapes and sizes as part of ritual belief systems.
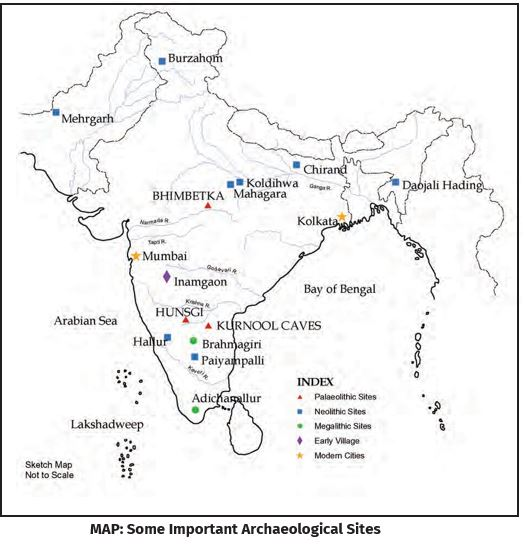
Megalithic Culture
- About: Megalithic Culture is a prehistoric cultural practice marked by the erection of massive stone structures called megaliths. Megaliths primarily served as burial sites located away from habitation areas.
- Time Period: Based on archaeological data, South Indian megalithic cultures spanned from 1000 BCE to 100 CE, with peak popularity between 600 BCE and 100 CE.
- The Megalithic period in South India was a full-fledged Iron Age culture, where iron technology was fully realized. Iron objects such as weapons and agricultural implements have been found across the region.
- Geographical Distribution: The main concentration of megalithic culture is in the Deccan, especially south of the Godavari River.
- Key sites include Brahmagiri and Chandravalli (Karnataka), Junapani, Khapa and Muhurjhari (Maharashtra), and Adichanallur (Tamil Nadu).
- It has also been found across the Punjab Plains, the Indo-Gangetic basin, Rajasthan, Gujarat, and Burzahom in Jammu and Kashmir.
- Subsistence and Culture: The megalithic people lived on a combination of agriculture, hunting, fishing, and animal husbandry. Rock paintings at these sites depict scenes of hunting, cattle raids, and group dancing, providing insight into their social and cultural life.
| Read More: Megalithic Footprints and Human Figure |


Rapid Fire
India-Japan CEPA Meeting
The 7th Joint Committee Meeting under the India–Japan Comprehensive Economic Partnership Agreement (CEPA) was held in Tokyo to review implementation issues and discuss enhancing bilateral economic engagement.
- Discussions covered a wide range of issues, including bilateral trade and investment, improving the business environment, and preparations for the upcoming 14th Ministerial Conference (March 2026, in Yaoundé, Cameroon) of the WTO.
India–Japan CEPA
- About: The India-Japan CEPA, which came into effect in August 2011, is a landmark bilateral trade pact that covers trade in goods, services, movement of natural persons, investments, intellectual property rights (IPR), customs procedures, and other trade-related issues.
- Tariff Elimination: The agreement envisages the abolition of tariffs on over 94% of items traded between the two countries over a period of 10 years.
India–Japan Economic Relations
- Bilateral Trade Volume: Total trade stood at USD 22.85 billion in 2023-24. Exports from Japan to India were USD 17.69 billion, while Indian exports to Japan were USD 5.15 billion, indicating a substantial trade deficit for India.
- Trade Share Rankings: India ranks 18th in Japan's total trade (1.4% share) while Japan ranks 17th in India's total trade (2.1% share).
- FDI Inflows: Cumulative Japanese FDI into India from 2000 to December 2024 stands at approximately USD 43.2 billion, making Japan the 5th largest source country for FDI into India.
- Japanese FDI is primarily concentrated in the automobile, electrical equipment, telecommunications, chemicals, financial services (insurance), and pharmaceuticals.
| Read More: Revisiting India-Japan Relations |


