Indian Economy
Gist of Economic Survey 2018-19
- 03 Sep 2019
- 138 min read
.png)
Chapter 1
Shifting Gears: Private Investment as the Key of Growth, Jobs, Exports and Demand
Overview
This chapter provides a brief overview of the Economic Survey and talks about India’s achievement in the past five years and shares a blueprint for the next five years.
Key Highlights
- To achieve the objective of becoming a $5 trillion economy by 2024-25, India needs to sustain a real GDP growth rate of 8%.
- This growth rate can only be sustained by a ‘virtuous cycle’ of savings, investment and exports catalysed and supported by a favourable demographic phase.
- Investment, especially private investment, is the key driver that drives demand, creates capacity, increases labour productivity, introduces new technology, allows creative destruction, and generates jobs.
- The Survey departs from the traditional Anglo-Saxon thinking by advocating a growth model that views the economy as being in a virtuous cycle or a vicious cycle.
Last Five Years : The Accomplishments
- Indian Economy has performed fairly well in the past five years. It has opened several pathways for trickle-down so that the benefits of growth and macroeconomic stability reach the bottom of the pyramid.
- Macroeconomic Stability
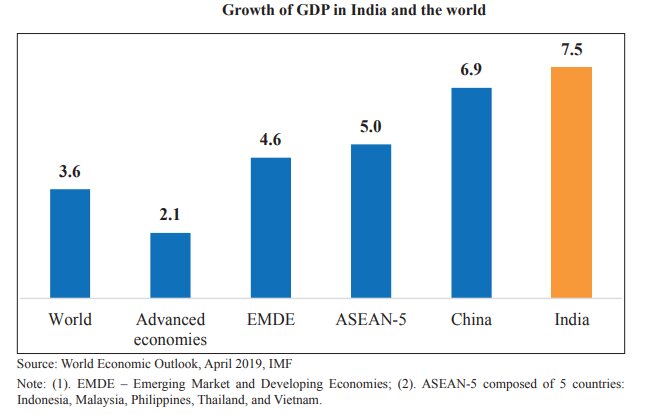
- India has become the 6th largest economy by sustaining growth rates higher than China, and has been regarded as the fastest growing major economy.
- Average Inflation has reached the lowest level since independence and was less than half of the level of the preceding 5 years.
- Monetary Policy Committee (MPC) constituted in 2015 has been successful in containing inflation. It sets a target of 4% (+/- 2) for headline inflation.
- Current Account Deficit (CAD) has remained within manageable limits.
- Foreign Reserves have reached the highest levels.
- Beneficiary Focus & Targeted Delivery
- In order to ensure the benefits of growth and macroeconomic stability reach the bottom of the socio-economic ladder, the govt. has developed the ability to provide targeted support through:
- Aadhar Act 2016: more than 90% population coverage.
- Pradhan Mantri Jan Dhan Yojna: financial inclusion
- Direct Benefit Transfer: 370 cash-based schemes transferring benefits.
- In order to ensure the benefits of growth and macroeconomic stability reach the bottom of the socio-economic ladder, the govt. has developed the ability to provide targeted support through:
- Infrastructure
- The creation of physical infrastructure accelerated significantly in the last 5 years.
- All villages have been electrified
- Udan Scheme is extending flight connectivity to tier-3 and tier-4 cities
- Out of total, 20% national highways have been constructed in the last 4 years.
- Infrastructure project in North-East has gained huge momentum.
- Federalism
- On the recommendation of 14th Finance Commission, the devolution of funds to States has increased from 32% to 42% from the pool of central taxes
- NITI Ayog has institutionalized cooperative federalism by incorporating both Centre and State in jointly evolving strategies for addressing development challenges.
- Introduction of GST has promoted cooperative federalism as almost all decisions are taken by consensus among members of GST Council.
- Corporate Exits
- Insolvency and Bankruptcy Code (2016) has improved the overall business culture by consolidating the insolvency resolution process into a single law.
Next Five Years: A Blueprint for Growth and Jobs
- Emphasising Growth
- India aims to grow into a $5 trillion economy by 2024-25, which will make India the third-largest economy in the world. To achieve this aim, the Indian economy requires a real annual growth rate in GDP of 8%.
- Ingredients required for generating such growth
- Experience from high growth East Asian economies, like China’s explosive growth over 4 decades and post war development of Hong Kong, Singapore, South Korea and Taiwan, suggest that high growth rates can only be sustained by a virtuous cycle of savings, investment, exports and growth catalysed by a favourable demographic phase.
- Investment (especially private investment), is the key driver that drives demand, creates capacity, increases labour productivity, introduces new technology, allows creative destruction and generates jobs.
Why a virtuous cycle over a vicious cycle?
- When the economy is in a virtuous cycle, investment, productivity, growth, job creation, demand and exports, feed into each other and enable animal spirits in the economy to thrive.
- In contrast, when the economy is in a vicious cycle, moderation in these variables dampen each other and thereby kill the animal spirits in the economy.
How to enable self sustaining virtuous cycle?
- Investment as key driver
- Presenting data as public good
- Ensuring policy consistency
- Encouraging behavioural change
- Emphasizing legal reforms
- Importance of Savings
- High investment effort must be backed by domestic savings. This phenomenon has been referred to as “Feldstein-Horioka Puzzle”
- Savings and growth are positively correlated but this positive correlation is stronger than that exists between growth and investment.
- Entrepreneurs are exposed to idiosyncratic business failures due to the risky nature of investment which leads to loss of invested capital. Therefore, savings have to increase more than investment to allow for the accumulation of precautionary savings.
- Jobs
- It is often claimed that ‘investment’ displaces job, which has led to debate of labour-intensive versus capital-intensive mode of production.
- Chinese economic model illustrates that high investment rates also creates jobs. Capital investment fosters job creation as capital goods production, R&D and supply chain also produces jobs.
- International experience from East Asia and Pacific have shown that unemployment rate decreases with greater capital formation, therefore it can be conclusively said that capital and labour are complementary in a high investment rate scenario.
- Exports
- In a high income growth scenario, domestic consumption only acts as a force multiplier, which may be constrained by high level of savings, therefore real demand for large capacities came from exports.
- East Asian economies illustrates that there is a strong correlation between growth in exports and GDP growth.
- India’s share in global exports is quite low and current disruptive environment poses an opportunity for India to insert itself into global supply chain.
- Therefore, recommendations of High Level Advisory Group led by DR. Surjit Bhalla (2019) must be taken into consideration to enhance exports.
Going Beyond the Economics of Equilibrium in the Blueprint
- The traditional Anglo-saxon view considers the concept of equilibrium as a key tenet. Secondly, the traditional view often attempts to solve job creation, demand, exports, and economic growth as separate problems.
- However, following the Global Financial Crisis this view has come under significant challenge. Hence, economists are slowly departing from the traditional Anglo-saxon view to a growth model that views the economy as being in constant disequilibrium.
- Also, economists believe that the macro-economic phenomena (job creation, demand, exports, and economic growth) exhibit significant complementarities.
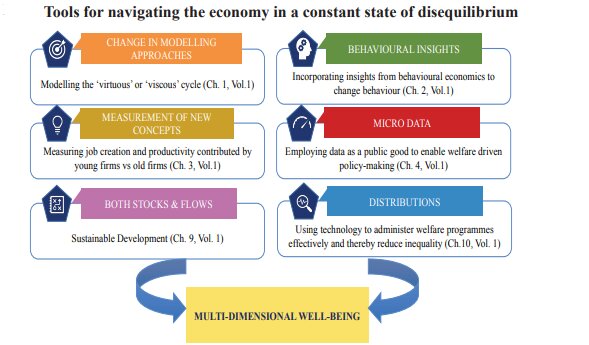
Navigating a World of Constant Dis-Equlilbrium
- Earlier, our economic policies such as Five Year Plans, were framed on the concept of equilibrium, which largely failed due to non predictive nature of world scenario.
- Therefore, navigating this uncertain world of dis-equilibrium requires 3 elements:
- a clear vision
- a general strategy to achieve the vision
- the flexibility and willingness to continuously recalibrate tactics in response to unanticipated situations.
Way Forward
- The creation of an ecosystem for private investment, especially in the new economy, is therefore critical to enable the virtuous cycle of investment, demand, exports, growth and jobs.
Keywords For Mains
|
Important Facts and Trends
|
Questions For MainsQ1. Explain the correlation between savings and investment in a high growth economies. Q2. Critically analyse the traditional anglo-saxon model of economics. Q3. Examine the factors that are essential for India to realise the aim of $5 trillion economy by 2024-25. |
Chapter 2
Policy For Homo Sapiens, Not Homo Economicus: Leveraging the Behavioural Economics of “Nudge”
Overview
This chapter deals with behavioural economics and its application in the government policies to achieve socially relevant outcomes and also lays out an ambitious agenda for social change.
Purpose of Public Policy
- Public policy influences people to act in a socially desirable way, be it conserving natural resources, educating children, respecting the human rights of fellow citizens or saving for retirement.
- Therefore, public policies can be graded on a spectrum capturing how strongly they influence behaviour.
Behavioural Economics
- Behavioral Economics is the study of psychology as it relates to the economic decision-making processes of individuals and institutions.
- People’s behaviour is influenced significantly by social norms and understanding the drivers of these social norms can enable social change.
- People suffer from tremendous inertia while making a choice, they prefer to anchor on to the default option.
- People find it difficult to sustain good habits, repeated reinforcements and reminders of successful past actions can help sustain changed behaviour.
- Behavioural economists have discovered the efficacy of a new class of “nudge” policies that lie between laissez faire and incentive.
- Note: Nudge policies are those policies which gently steer people towards desirable behaviour even while preserving their liberty to choose.

Classical Economics Vs Behavioural Economic
- Adam Smith, in his book the ‘Theory of Moral Sentiment’, noted that a wide range of human choices are driven and limited by our mental resources i.e., cognitive ability, attention and motivation.
- Behavioural economics relies on this essential insight from human psychology that real people do not always behave like robots, rational and unbiased individuals that form the basis of classical economic theory called “homo economicus”
Principles of Behavioural Economics
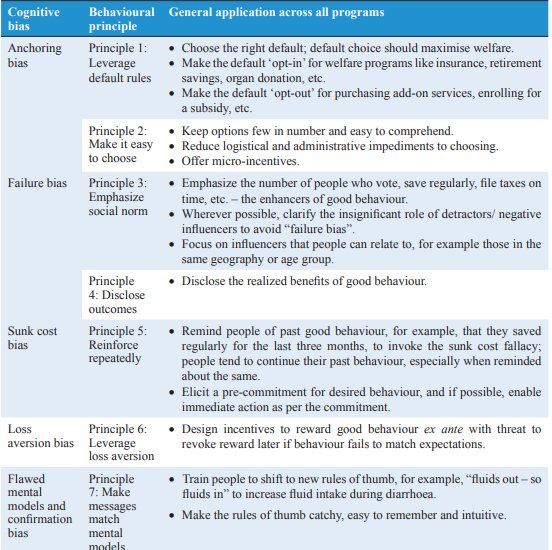
- Behavioural Economics provides ample scope for leveraging the efficacy of public programmes in India. The seven principles of behavioural economics that are used to overcome cognitive bias have been described below:
Successful Implementation of Behavioural Insights in India
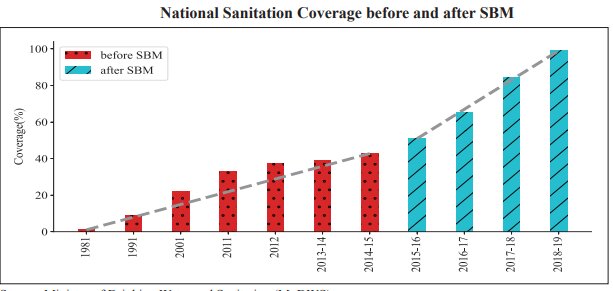
- Swachh Bharat Mission (SBM)
- SBM was launched on 2nd October 2014 to achieve universal sanitation coverage.
- SBM relies on community based approach to sanitation, thereby creating a mass movement on the lines of ‘satyagraha’ for cleaner India.
- It is the first one to emphasize behavioural change, not only in construction of toilet but also to increase their usability on the regular basis.
- To initiate behavioural change in use of toilets, more than 5 lakh swachhagrahis i.e., foot soldiers of the SBM were recruited. These swachhagrahis were able to leverage their social ties within their villages to effect change.
- The act of provoking disgust or shaming people for open defecation elicit emotional reactions that are more effective than those that deliver plain messages.
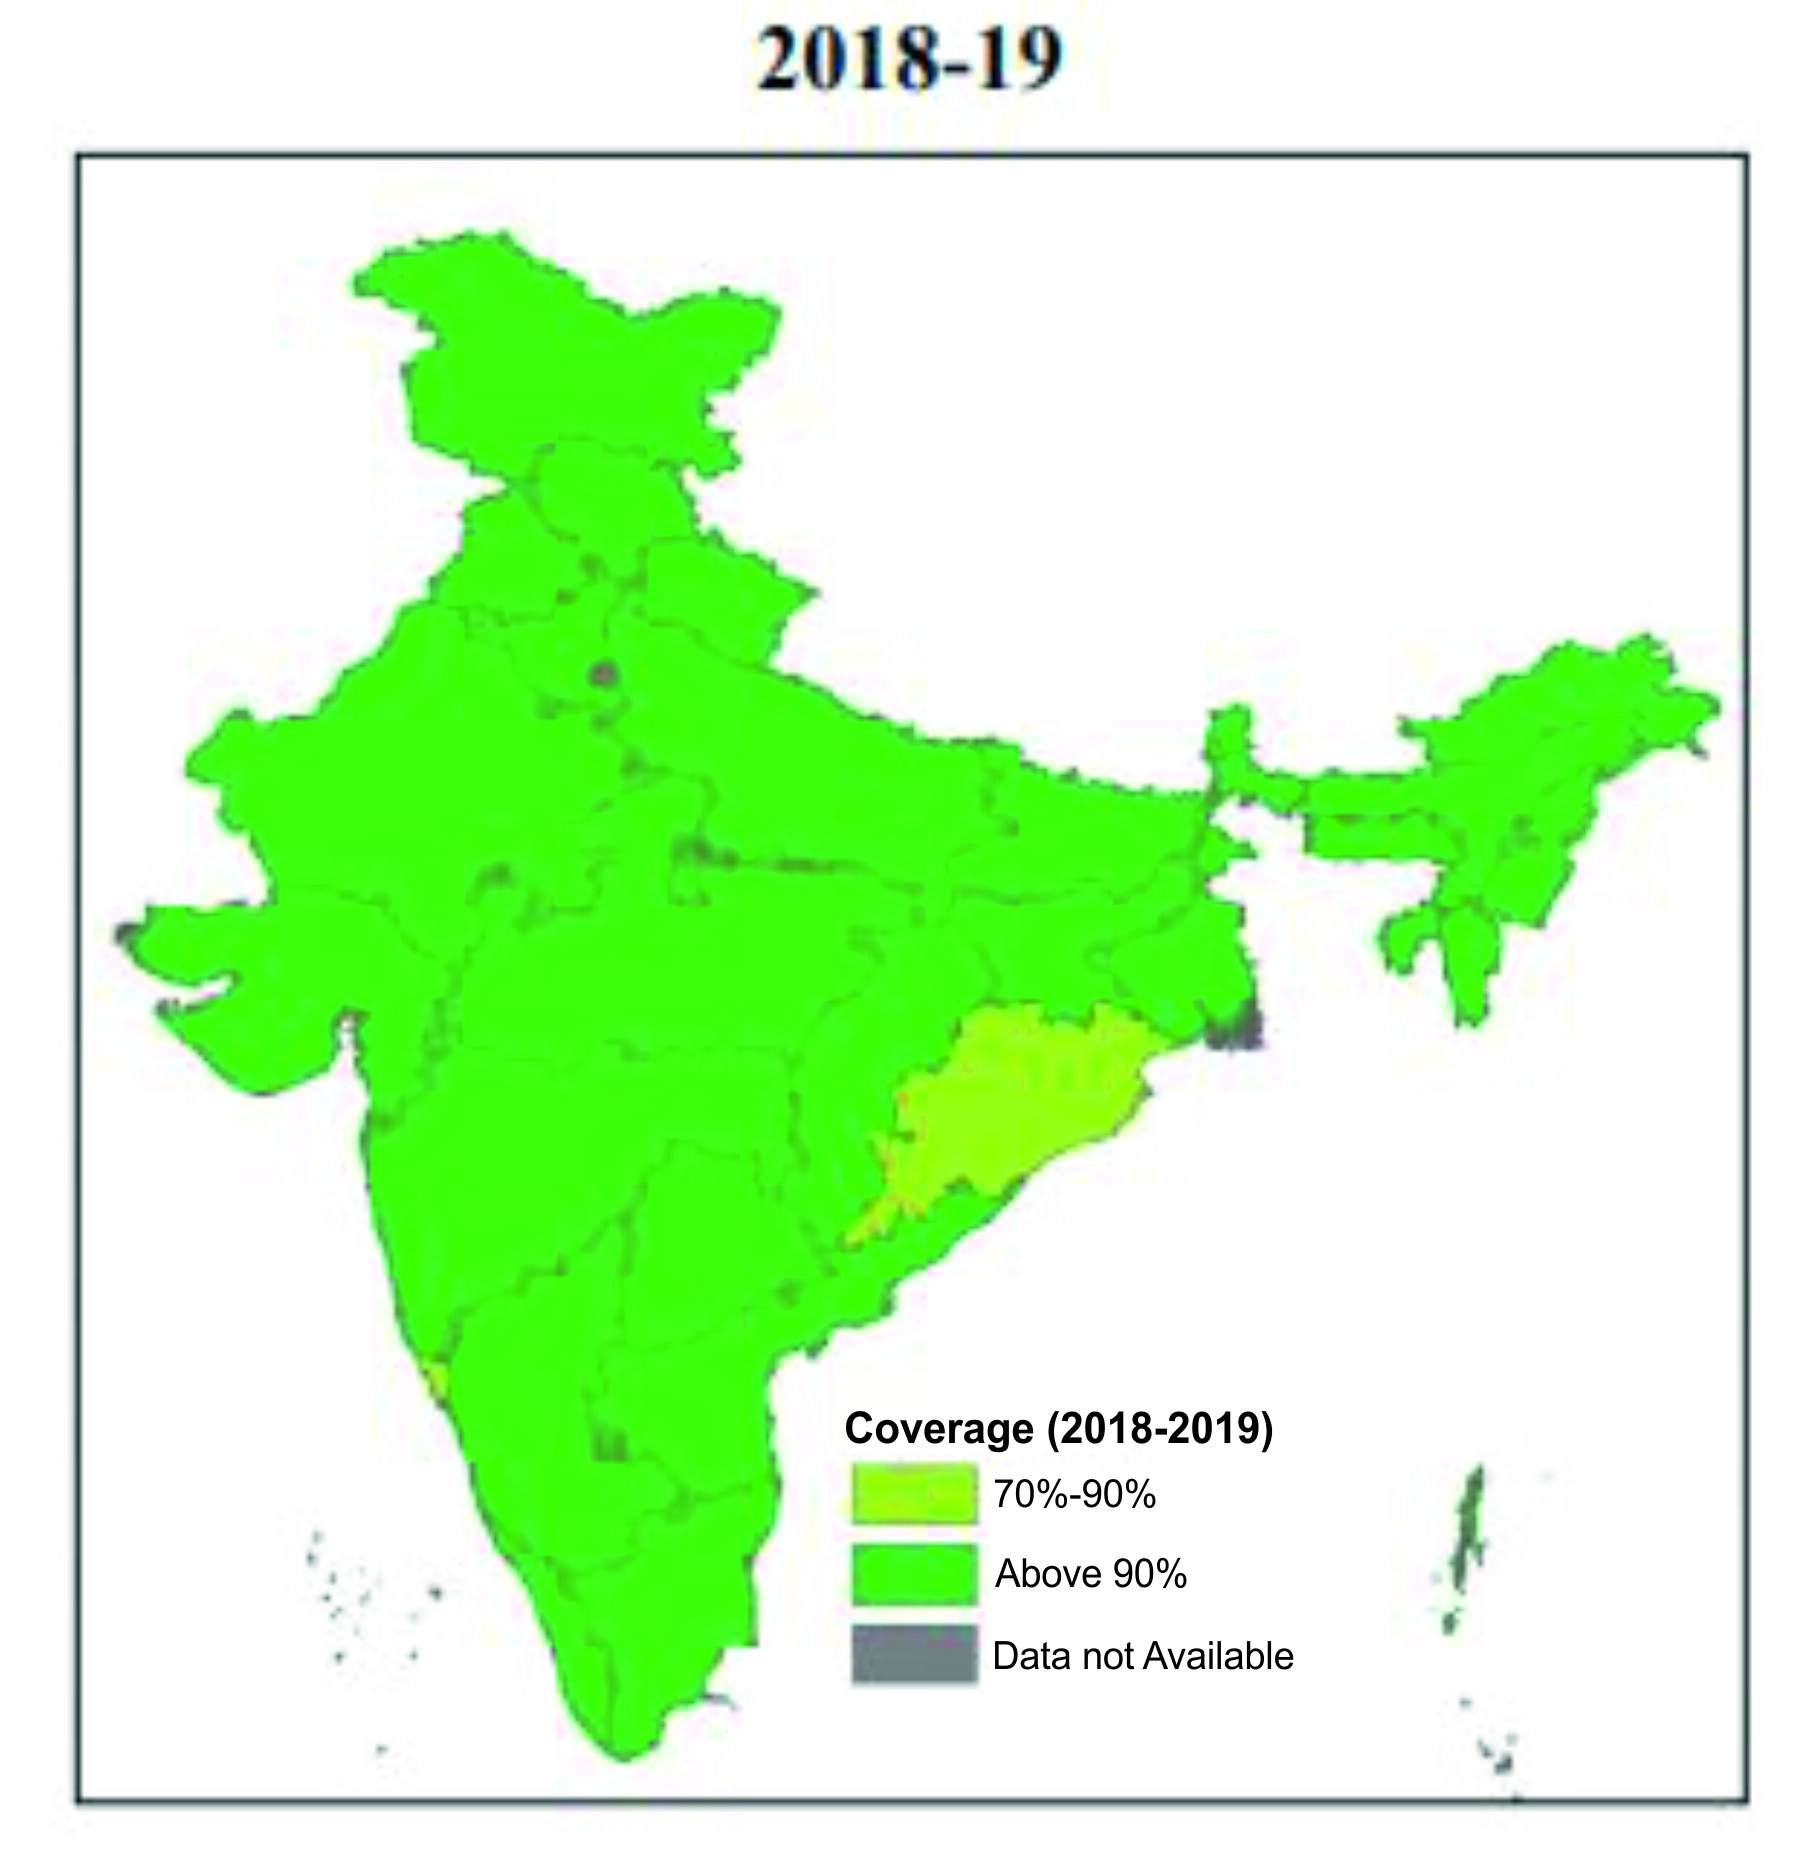
- According to National Annual Rural Sanitation Survey (NARSS) 2018-19:
- 93.1% of rural households had access to toilets and 96.5% of these households use them regularly.
- Female literacy and early marriage of girls correlate strongly with access and usage of toilets therefore use of behavioural insights in SBM can be effectively used to improve the social indicators.
- Beti Bachao, Beti Padhao (BBBP)
- BBBP Scheme was launched from Panipat to address the issue of decline in Child Sex Ratio and related issues of empowerment of girls and women.
- India’s child sex ratio at birth has been consistently falling for decades untill the first decade of 21st century. Between 2001 and 2011(census), 21 out of 29 states registered a decline in child sex ratio.
- To emphasize behavioural change, the campaign was launched from Panipat, which is famous for various battles in the history, as a symbolic gesture in the fight against this socially ingrained bias against the girl child. Panipat also had the worst child sex ratio at 834 as compared with the national average of 919 (Census, 2011).
- To change people’s attitude towards the girl child they needed to stop viewing girls as burdens and start celebrating them instead. With the 'Selfie with Daughter' campaign the celebration of the girl child quickly became the norm. Most people wanted to conform, and more and more parents posted selfies with their girls.
- The strategy addresses failure bias, therefore focus must be on people who treat their girls fairly.
- BBBP has had an impact particularly on large states like UP, MP Rajasthan, Chhatisgarh, Andhra Pradesh and Jharkhand which had very poor child sex ratio.
Power of Clear Messaging
- Several other programmes have successfully employed the power of messaging as evident from the names used for various recent schemes.
- The Namami Gange scheme seeks to arrest the pollution of Ganga River and revive it wherein Namami Gange means ‘I pray to Ganga’ as the river Ganga is revered in our culture.
- POSHAN Abhiyan is a multi-ministerial convergence mission to ensure a malnutrition free India by 2022 wherein Poshan means holistic nutrition.
- Ayushman Bharat envisages universal and affordable access to good quality health care services wherein Ayushman means ‘Being Blessed with long life’.
An Aspirational Agenda for Path-Breaking Change
- From BBBP to BADLAV (Beti Aapki Dhan Lakshmi Aur Vijay Laxmi)
- In India, gender inequality needs a revolutionary campaign which must be aligned with the principles of behavioural economics.
- The campaign must draw on social and cultural norms because they play a dominant role in influencing behaviour.
- Therefore, the campaign under BBBP can be labelled as BADLAV to represent change towards gender equality.
| Principle | Applying the Principle for BADLAV |
| 1. Make it easy to choose | Simplifying procedure for women. |
| 2. Emphasize Social norms | Projecting positive social norms and highlighting prominent personalities or even mythological characters so that people can relate to them. |
| 3. Disclose Outcomes | Publishing gender reports or audits in public domain. |
| 4. Reinforce Repeatedly | People’s memories are short-lived, they need to be reminded of what is socially acceptable. Therefore, regular visual or print advertisement can reinforce positive attitude. |
| 5. Leverage Loss Aversion | Modifying reward structure to prevent higher aversion of women to competition.eg: reducing application fees for women. |
| 6. Make Message Match Mental Model | All gender stereotypes can be removed to provide more flexibility to women. |
- From Swach Bharat and Ayushman Bharat to Sundar Bharat
- A strong way to reinforce behaviour is by getting people to pre-commit to a certain course of action. Studies suggest that if people are pre-committed to doing something, they are much more likely to do it.
- Taking our learning from the power of behavioural economics in the Swachh Bharat scheme, the way forward is to develop an all-encompassing behavioural economics architecture for the entire health sector.
- Due to information asymmetry between the doctor and the patient, hyperbolic tendencies of health consumers, and high variability of health care expenditures, people often make decisions that are not in their best interest. This ranges from failing to enrol in health insurance, engaging in harmful behaviour like smoking.
| Principle | Applying Principle for Sundar Bharat |
| 1. Leverage the Default Rule | Providing default insurance plan may significantly improve the insurance coverage. |
| 2. Make it Easy to Choose | Customising health plan according to customer needs and minor alterations to the school menus may promote healthy food habits among children. |
| 3. Emphasize Social Norms | Highlighting incidents of death of celebrities from drugs may help to contain drug menace among youth. |
| 4. Disclose Outcomes | Disclosing the tangible benefit of handwashing & family planning practice experienced by other people may promote healthy practices. |
| 5. Reinforce Repeatedly | Periodic reminders to people to plan their vaccination or taking medicines regularly by means of messages or social media. |
| 6. Leverage Loss Aversion | People often find it difficult to achieve goals like weight loss or ceasing to smoke. People voluntarily made to post bonds (deposit contracts) or lottery tickets on a website that will be returned to them if they achieve their goals, but are forfeited otherwise, can help them achieve these difficult goals. |
| 7. Make Message Match Mental Models | Awareness Campaigns to correct flawed mental model. |
- ‘Think about the Subsidy’
- ‘Give It Up’ encouraged Above Poverty Line (APL) households to voluntarily surrender their LPG subsidies but due to lack of economic incentives, the program mainly relied on better judgement to voluntarily give up their subsidy. However, still there is a huge scope to expand the campaign.
- Even if people are truly interested in giving up their subsidies; their actions may differ from their intent as they need to be moved to action with a gentle nudge. A good choice architecture can aid in closing this gap between intention and action.
- People have a strong tendency to go with the status quo. ‘Give It Up’ needs to employ this insight.
| Principle | Applying Principle for ‘Think about the Subsidy’ |
| 1. Leverage Default Rules | Modifying default option so that people need to opt-in to continue their subsidy. |
| 2. Make it Easy to Choose | Utilizing impulsive behaviour for giving up subsidy through mobile apps etc. |
| 3. Emphasize Social Norms | Making people feel good about giving up subsidies can help establish the correct social norms. |
| 4. Disclose Outcomes | Advertising the people who gave up subsidy, so as to motivate others. |
| 5. Reinforce Repeatedly | Videos such as beneficiary thanking subsidy givers must be circulated to reinforce the feelings. |
| 6. Leverage Loss Aversion | Motivating individuals to pledge a certain amount of subsidy when they feel most inspired. |
| 7. Match Message to Mental Model | Fiscal Subsidies can be made cost effective by frequently reminding people so that they can plan their schedule.eg: taking up vaccination etc. |
- Jan Dhan Yojana
- Jan Dhan Yojana opened a large number of bank accounts in a short span of time, but its success relies on people using these accounts regularly. The programme’s mandate includes access to services like credit, insurance etc. The programme offers tremendous scope to employ behavioural insights.
| Principle | Applying the Principle |
| 1. Leverage Default Rules | Make auto enrollment into a saving plans |
| 2. Make it Easy to Choose | Minimizing complexities in opting for schemes for common people. |
| 3. Emphisize Social Norms |
Using information campaigns to highlight the number of people using bank accounts. Sending regular messages about account details etc can increase usability. |
| 4. Disclose Outcomes | Periodically reminding holders of dormant account about the number of people using accounts. |
| 5. Reinforce Repeatedly | Reminding people about their past savings can reinforce good saving behaviour. |
| 6. Leverage Loss Aversion | Using favourable time such as harvest season or increase in salary to increase the savings of people |
| 7. Make Message Match Mental Model. | Customising saving plan according to customers needs like home saving plan, educational saving plan etc. |
- From Tax Evasion to Tax Compliance
- In order to enhance tax compliance, behavioural insights need to be employed to modify the social norm from ‘evading taxes is acceptable’ to ‘paying taxes honestly is honourable’.
- The intrinsic motivation of taxpayers to pay taxes is driven primarily by two perceptive factors - vertical fairness and horizontal fairness.
- Citizens perceive vertical fairness to be low if they find their tax payments being squandered in wasteful public expenditure or by corruption. Similarly, perceptions of horizontal fairness suffer when the employee class is forced to contribute more than the self-employed class.
| Principle | Applying the Principle |
| 1. Leveraging the Default Rule | Automatic deduction of taxes and directing refunds into saving accounts |
| 2. Make it Easy to Choose | Making tax filing process simpler |
| 3. Emphisize Social Norms | Promoting tax paying as honourable |
| 4. Disclose Outcome | Public shaming of eligible individuals who do not pay taxes. |
| 5. Reinforce Repeatedly | Periodically informing people about neighbours or people living around paying taxes honestly. |
| 6. Leverage Loss Aversion | Refunds at the time of tax filing may increase compliance. |
| 7. Match Messages to Mental Models | Making reciprocity appeal to boost morale of tax compliance. |
Using Behavioural Economics to Avoid the Seven Social Sins
- India @75 is envisaged as a ‘New India’ where every individual realizes his or her full potential and looks for opportunities to contribute rather than claim entitlements.
- Mahatma Gandhi’s Seven Social Sins, published in Young India on October 22, 1925, provide deep insights into the role of social and political conditions shaping human behavior. Each of these is a statement of principle that can be interpreted and utilized for nudging people towards desirable behaviour.
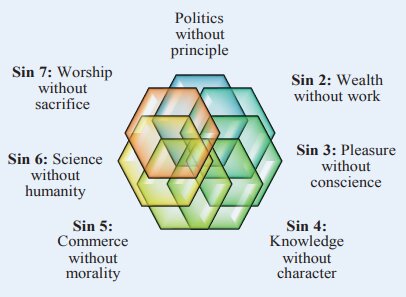
| Social Sins of Gandhiji | Applying the Principles of Behavioural Economics |
|
1. Politics without Principles
|
Leverage Loss Aversion
|
|
2. Wealth without Work
|
Disclose Outcomes
|
|
3. Pleasure without Conscience
|
Leverage Default Rules
|
|
4. Knowledge without Character
|
Match Messages to Mental Models
|
|
5. Commerce without Morality
|
Emphasising Social Norms
|
|
6. Science without Humanity
|
Making it Easy to Choose
|
|
7. Worship without Sacrifice
|
Reinforce Repeatedly
|
Implementing The Aspirational Agenda For Behavioural Change
- In India, social and religious norms play a dominant role in influencing behaviour of the society therefore the possibilities of employing behavioural economics to policy making are enormous.. To avail these benefits, following measures are suggested for implementation.
- Behavioural economics unit in the NITI Aayog.
- Behavioural economics audit for every government program
- Appropriate coordination with state government to implement principles of behavioural economics in state policies and programs.
Keywords For Mains
|
Important Facts and Trends
|
Important Questions For MainsQ1. Briefly explain the principles of behavioural economics and analyse its application in Swachh Bharat Mission. Q2. “What is honoured in a country is cultivated there.”- PLATO |
Chapter 3
Nourishing Dwarfs to become Giants: Reorienting Policies for MSME Growth
Overview
This chapter examines how policies followed over the last seven decades stifle the growth of Micro, Small & Medium Enterprises (MSMEs) in the economy. It lays out the policy map for re-orienting the policy stance to foster the growth of MSMEs and thereby greater job creation and productivity in the economy.
Key Highlights
- Job creation in large numbers remains an urgent imperative to provide financial and social inclusion for our young population.
- Job creation in India, however, suffers from policies that foster dwarfs instead of infant firms that have the potential to grow and become giants rapidly.
- According to the Survey, if we consider our labour force participation rate (LFPR) would remain at 60% in the next two decades, about 55-60 lakhs jobs needs to be created annually over the next decade.
- It, thus, becomes imperative to reorient the policy stance to foster the growth of MSMEs and thereby greater job creation and productivity in the economy.
Categorization of Firms
- Small Firm: Firms employing less than 100 workers.
- Large Firm: Firms employing more than 100 workers
- Young Firm: Firms which are small when young but on aging becomes large
- Dwarfs Firm: Firms which are both small and aged more than 10 years having stunted growth
The Bane of Dwarfism
- Dwarfs are small firms that never grow beyond their small size, dominate the Indian Economy and hold back job creation and productivity.
- Dwarfs are lowest contributors to employment and productivity while firms that grow over time are the biggest contributors.
- Inspite of aging, small firms have low productivity and value addition while infants disproportionately increase their share and productivity
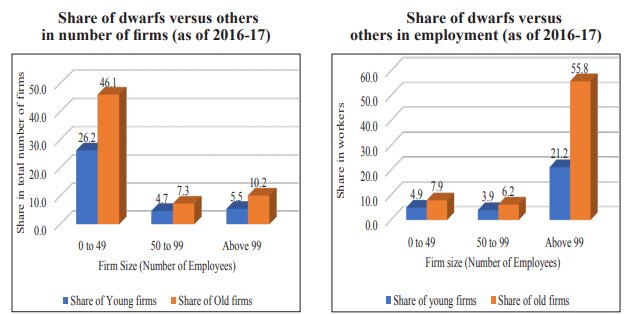
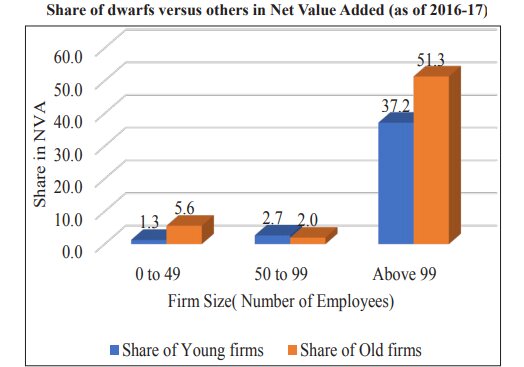
- Dwarfs account for half of all the firms in organised manufacturing by number, their share in employment is 14.1% and in NVA is 7.6%.
- There is a common perception that small firms generate a higher number of new jobs. But higher levels of job creation in small firms co-exist with job destruction, thereby leading to lower levels of net job creation.
- The notion that small firms create jobs has prevailed because it is the young firms, who also happen to be small, create the most jobs.
Size vs Age Effect
- Compared to small firms, young firms contribute significantly to employment and value addition.
- Firm with less than 10 years accounts for about 30% of employment and about half of NVA shows a downward trend with with an increase in firms age.
- The average 40 years old firms in USA generate 5 times more employment and are 2.5 times more productive as compared to 40 years old Indian Firms.
- The average employment level for 40-year old enterprises in the U.S. was more than 7 times that of the employment when it was newly set up while it is just 40% greater for Indian Firms.
The Role of Policy in Fostering Dwarfism
- Our policies protect and foster dwarfs rather than infants. The key distinction here is that while infant firms are small and young, dwarfs are small but old. Thus, while infant firms can grow to become large firms that are not only more productive and generate significant employment, dwarfs remain small and contribute neither to productivity nor to jobs.
- These policies create a ‘perverse’ incentive for firms to remain small. If the firms grow beyond the threshold, then they will be unable to obtain the said benefits. Therefore, entrepreneurs find it optimal to start a new firm to continue availing these benefits. But these small firms are not able to enjoy the benefits, which the large firms get from economy of scale and therefore remain unproductive.
Factors Contributing
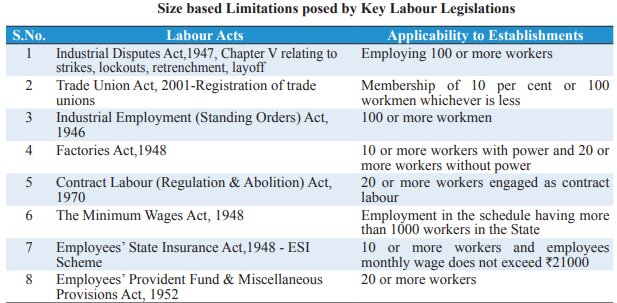
- Labour Regulation
- India has a plethora of labour laws, regulations and rules, both at the centre and the state levels that govern the employer employee relationship.
- The transaction cost inherent in complying with such regulation creates perverse incentives for firms to remain small.
- Flexibility of Labour Laws creates a conducive environment for growth and employment generation.
- Flexible States contribute disproportionately more to labour, capital and productivity while inflexibility promotes substitution of labour with capital.
- Inflexible states are suffering in almost all dimensions, be it employment, capital attractiveness, productivity or wages.
Unique Case of Rajasthan
Prior, to labour reforms of 2014-15, the growth story of Rajasthan has been similar to rest of India. But after reforms both number of large firms and Compound Annual Growth Rate increased significantly.
- Small Scale Reservation Policy
- The Small Scale Industries (SSI) reservation policy was introduced in 1967 to promote employment growth and income redistribution.
- Policy promotes reservation of products for manufacturing for firms on the basis of size.
Impact of SSI
- The policy resulted in substantial misallocation of resources and productivity losses which resulted in:
- Substantially lower the avg. capital to labour ratio.
- The overall demand for labour and market wage rate are much lower due to lower capital accumulation.
- It resulted in inefficient allocation of managerial talent.
- The economic restrictions resulted in higher price for manufactured product which in-turn makes them uncompetitive in the global economy.
- It also created perverse incentives for firms to remain small and unproductive
De-Reservation of Products
- The de-reservation of several product categories during the period 1997 to 2007 resulted as:
- Job Creation: Net job creation was monotonically increased with firm size and was maximum among large firms (500+ employees)
- Job Destruction: Maximum for small firms.
- De-regulation suggested that infants, not dwarfs, contribute significantly to job creation and productivity in the economy.
Need for Review
- Increased competition due to liberalization and globalisation.
- Resulted in monopoly like situation in production of some consumer good by large firms.
Way Forward
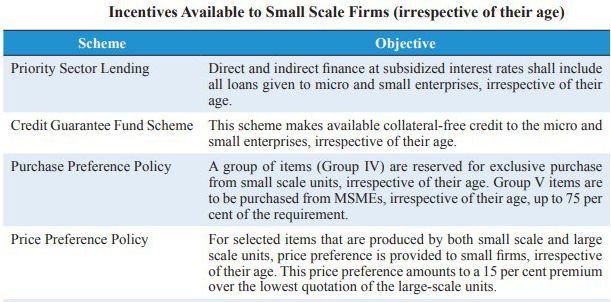
To unshackle MSMEs and thereby enable them to grow, all size-based incentives must have a sunset clause of less than ten years with necessary grand-fathering. Deregulating labour law restrictions can bring significant thrust to jobs creation. Following suggestions are made:
- Incentivizing ‘infant’ firms rather than ‘small’ firms
- Re-orienting Priority Sector Lending
- Sunset Clause for Incentives
- Focus on High Employment Elastic Sectors such as rubber manufacturing, plastic products, textiles and leather etc.
- Focus on Service Sectors with high Spillover Effects. For example: developing tourist centres will have ripple effect on job creation in different areas.
Keywords For Mains
|
Important Facts and Trends
|
Important Questions For MainsQ1.With the help of an example, briefly explain the impact of labour regulation on growth of firms in Indian economy. Q2 Critically analyse the government policies to support small industries that stagnated growth and suggest policy measures to arrest the ‘bane of dwarfism’. Q3.‘There is a perception that small firms create the largest number of jobs in Indian economy’. Critically analyse. |
Chapter: 4
Data Of the People, By the People, For the People
Overview
The chapter highlights the importance of data in today’s digital economy and how democratisation of data for public welfare can transform India. It talks about issues related to data and suggests a pathway for building a resilient data ecosystem.
The Economics of Data and Social Welfare
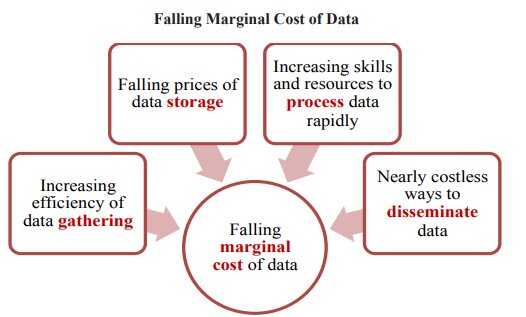
- In recent years, the world has witnessed an information explosion. As people shift their day-to-day activities online, they leave digital footprints of these activities i.e. they produce data about themselves and store this data on public and private servers.
- A few decades ago, gathering data requires a laborious survey but today it is accumulating online at a near-zero cost. Thus, the marginal cost of data has declined exponentially and the marginal benefit to society of using this data is higher than ever.
What is data?
- It can be defined as an information in digital form that can be transmitted or processed.
How data is being generated?
- As people increasingly use digital services to talk to each other, look up information, purchase goods and services, pay bills, transact in financial markets, file taxes, avail welfare services and engage with local leaders, data is being generated at an unprecedented scale.
Types of Data
- Anonymized Data: Data that is not linked to a specific individual but is still available at an individual level of granularity.
- Public Data: Data neither linked to an individual, nor at an individual level of granularity. Eg: Census.
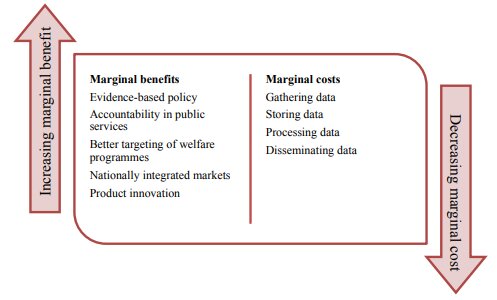
Utility of data for government
- enhance ease of living for citizens,
- enable truly evidence-based policy,
- improve targeting in welfare schemes,
- uncover unmet needs,
- integrate fragmented markets,
- bring greater accountability in public services,
- generate greater citizen participation in governance, etc
Why Must Data Be Treated as a Public Good?
- Data are generated by the people, of the people and should be used for the people.
- Data carries some of the characteristics of public goods.
- It is non-rivalrous, i.e., consumption by one individual does not reduce the quantum available for others.
- It can be made excludable, i.e., it is possible to exclude people from accessing data, as many database firms do by erecting pay walls.
- Robust data mechanism system can empower every stakeholder in society, from the Central Government to a local government body, from citizens to the private sector.
- It offers potential to reduce targeting error by minimising inclusion and exclusion errors in welfare schemes and has the potential to integrate markets nationally, reduce the need for middlemen, reduce prices for end consumers and increase returns for farmers.
- Data is not being harnessed equally in all segments. Private companies lack their footprint in harnessing data for social sector because they do not internalize the benefit of social welfare, the optimal amount of data that the private companies gather and disseminate falls short of the social optimum.
- As data for social welfare may not be generated by the private sector in optimal quantity, government needs to view data as a public good and make the necessary investments
- However, there are some kinds of data – particularly data gathered by governments on issues of social interest – that should be democratised in the interest of social welfare.
Building the Data System
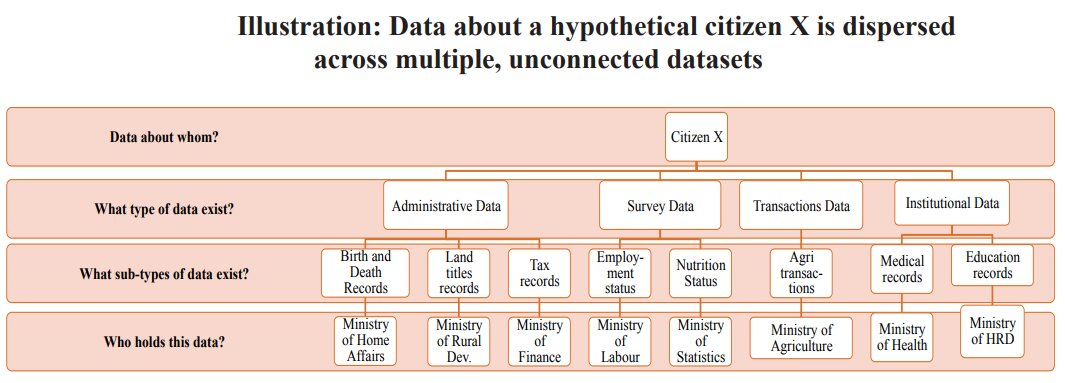
- The Government of India collects four distinct sets of data about people–
- Administrative Data: It is used mainly for non-statistical purposes and include birth and death records, crime reports, land and property registrations, vehicle registrations etc.
- Survey Data: It is used predominantly for statistical purposes.In these surveys, identity of participant is irrelevant and unreported. Eg: Census.
- Institutional Data: It refers to data held by public institutions about people. Eg:medical records in govt. hospitals, student information in govt. schools.
- Transactions Data: It is the data of an individual’s transactions such as those executed on the United Payment Interface (UPI) or BHIM Aadhaar Pay
Issues with Present Data System
- Currently, data collection in India is highly decentralised. For each indicator of social welfare, responsibility to gather data lies with the corresponding union ministry and its state counterparts.
- For example, data on an individual’s vehicle registrations is maintained by one ministry, whereas the same individual’s property ownership records lie with another ministry. When these different pieces could be put together, the whole is greater than the sum of the parts.
- Administrative and Survey data are comprehensively and robustly maintained while transactional and institutional data are in a fledgling state.
- The lack of common identifiers i.e single identity for every administrative unit. Every ministries or department uses different codes for the same administrative units.
- Therefore, there is a need to integrate the separate dataset.
- The efficacy of integrated system relies on three critical features.
- First, the ministries should be able to view the complete database, while they can manipulate only those data fields for which it is responsible.
- Second, updating of data should happen in real time and in such a way that one ministry’s engagement with the database does not affect other ministries’ access.
- Third and most importantly, the database should be secure with absolutely no room for tampering.
Initiatives for Integrating Data
- Local Government Directory:
- It is an initiative of the Ministry of Panchayati Raj
- It aims to address the problem of common identifier.
- It maps each land region entity to a local government body (like villages with their respective gram panchayats) and assigns location codes compliant with Census 2011.
- Samagra Vedika Initiative:
- It is an initiative of Telangana government.
- It links around 25 existing government datasets using a common identifier – the name and address of an individual.
- Seven categories of information about each individual were linked in this aggregation exercise – crimes, assets, utilities, subsidies, education, taxes and identity information. Each individual was then further linked to relatives such as spouse, siblings, parents and other known associate.
Eliminating all Privacy Concerns
- The prospect of empowering the government with such comprehensive, exhaustive information about every citizen may sound alarming at first. However, this is far from the truth.
- Large quantities of data already exist in government records, and the objective is to use this data in a more efficient way.
- People can always opt out of divulging data to the government, where possible.
- If there is no viable private market choice of certain public services, the choice to share the individually linked data from such services will always be with the citizen under the Data Access Fiduciary Architecture.
Data Access Fiduciary Architecture
- Each department of the government is responsible for making available the data they hold as a data provider.
- These departments must take care to appropriately treat private data and public data with the standards they require.
- This data is then made available through a Data Access Fiduciary to the Data Requestors. Data Requestors may be public or private institutions but can only access the data if they have appropriate user consent.
- The Data Access Fiduciary themselves have no visibility on the data due to end-to-end encryption.
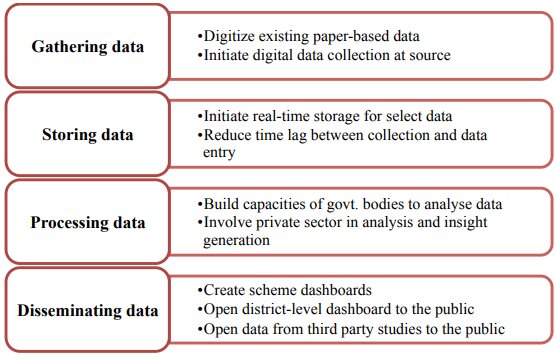
Transforming India’s Data Infrastructure
- Harnessing data consists of four steps – gathering, storing, processing and disseminating data, each of which offers room for improvement in India.
Applications
- A robust data backbone can empower every stakeholder in society, from the Central Government to a local government body, from citizens to the private sector
- Government: It can improve targeting in welfare schemes and subsidies by reducing both inclusion and exclusion errors and can significantly improve public service delivery.
- Private Sector: Within the statutory limits, data can be monetised to private sector to ease the pressure on government finances and while it carries huge potential to transform health and education sector.
- Citizens: They are the largest beneficiary of this data revolution. For eg: DigiLocker makes all their documents available, in a verified format in one place on the cloud.
- The Reserve Bank of India has announced the Non-Banking Financial Company-Account Aggregator (NBFC-AA) which enables the users to pull their financial data spreading along various institutions.
Way Forward
A truly digital ecosystem is achievable only when all layers of information that constitute the ecosystem are digitized. The benefits of creating data as a public good can be generated within the legal framework of data privacy. The data and information highway must be viewed as equally important infrastructure as the physical highways which can help India leapfrog to utilise the benefits of technological advances for the welfare of its people.
Important Facts and Trends
|
Important Questions For MainsQ1. Data can be used as a ladder for optimum social welfare. Critically analyse the implication of treating data as ‘public good’. Q2. Explain with the help of an example, how India’s data infrastructure can be transformed. |
Chapter: 5
Ending Matsyanyaya: How to Ramp up Capacity in the Lower Judiciary
Overview
The chapter deals with judicial administration in the country especially District and Subordinate Courts (D&S courts) and evaluate its performance on parameters such as disposal time, pendency time, case types and case clearance rate. The chapter further analyses the requirement of additional judges and efficiency gains across the various levels of courts to achieve 100% clearance rate as well as to eliminate the stock of pendency in the next five years.
Introduction
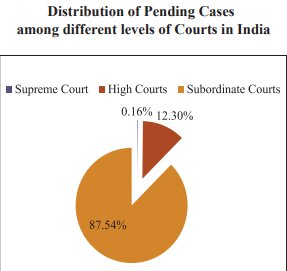
- There are about 3.5 crore cases pending in the judicial system, especially in district and subordinate courts
- The Preamble to the Constitution of India defines that the first role of the State is ‘to secure Justice i.e,social, economic, and political’ for all its people.
- Enforcement of contracts & dispute resolution have direct bearing on economic success & prosperity. Therefore, contract enforcement and dispute resolution remains the biggest constraint to ease of doing business.
- Pendency
- The pendency of a case on a given date is the time since the date of filing.
- More than 64% of all cases are pending for more than 1 year.
- Odisha, Bihar, West Bengal, Uttar Pradesh and Gujarat have higher average pendency for both civil and criminal cases as compared to the national averages.
- Punjab and Delhi have the least average pendency of cases.
- The pendency of a case on a given date is the time since the date of filing.
- Disposal
- Disposal time is measured as the time span between the date of filing and the date when the decision is passed.
- Nearly, 74.7% of the civil cases and 86.5% of the criminal cases are disposed off within three years.
- Bihar, Odisha & WB have higher average time than the national average for both civil and criminal cases.
- Punjab and Delhi have the lowest average disposal time.
- The average disposal time for civil and criminal cases in Indian D&S courts in 2018 was 4.4 fold and 6 fold higher respectively when compared with the average of Council of Europe members (2016).
- Case Clearance Rate (CCR)
- The Case Clearance Rate (CCR) is the ratio of the number of cases disposed off in a given year to the number of cases instituted in that year, expressed as a percentage.
- CCR had increased from 86.1% in 2015 to 90.5% in 2017, but then declined to 88.7% in 2018.
- CCR for civil and criminal cases in India was 94.76% and 87.41% respectively in 2018 while the Council of European (CoE) member has already achieved the CCR above 100% in 2016 for both civil and criminal cases.
Clearing the Legal Logjam
- A well-functioning legal system is the need of the hour for India for its potential economic and social multiplier effect. The key issues which need to be dealt urgently to make judiciary more efficient are:
- Achieve 100% CCR to prevent further accumulation of cases.
- Clearing the existing pendency of cases.
- Using the simple input-output model at current efficiency, following calculations have been made:
| Supreme Court | High Court | D&S Court | |
| Pendency | 56.2 Lakh | 40.22 Lakh | 3.04 Crore |
| Case Clearance Rate | 98% | 88% | 89% |
| Annual Disposal Rate (per judge) | 1,179 case | 2,348 case | 746 case |
| Additional Judges required to achieve 100% Clearance in a year | 1 | 93 | 2279 |
| Additional Judges required to clear all backlog in 5 years. | 8 | 361 | 8,152 |
Making Indian Courts More Productive
Efficiency and vacancies are the two crucial issues affecting the performance of Indian Judicial System and there is ample scope for improvement. Apart from them, some of the suggestions to improve the performance has been discussed below.
- Increasing the number of working days: Indian courts close down for significant periods due to vacations as Supreme Court works only for 190 days in a year. Significant improvement can be made in the performance of Supreme Court and some High Courts while lower court are most likely to remain unaffected as their average working days are almost the same as government departments.
- Establishment of Indian Court and Tribunal Services: Most judicial reforms tend to focus only on the quality and quantity of judges, but a major problem lies with the quality of the administration of the court system. The main responsibility for administration in Indian courts is assigned to the Chief Judicial Officer which is not conducive to the time demands of his judicial duties. The major roles to be played by ICTS would be:
- provide administrative support functions needed by the judiciary
- identify process inefficiencies and advise the judiciary on legal reforms
- implement the process re-engineering.
- Deployment of technology
- eCourts Project
- Implemented by Ministry of Law & Social Justice under National e-governance mission.
- Digitisation of district and subordinate courts as well as upgradation of ICT at the higher level.
- National Judicial Data Grid
- Monitoring tool to identify, manage and reduce pendency of cases.
- eCourts Project
Keywords For Mains
|
Important Facts and Trends
Note: Focus on trends and not on exact figures. |
Important Questions For MainsQ1. “The single biggest constraint to ease of doing business in India is now the ability to enforce contracts and resolve disputes.” In the context of the above statement, examine how the legal logjam can be cleared in our country. Q2. Economic success and prosperity of the country are closely linked to it’s judicial and legal landscape. Discuss the implications of pendency of cases on the economy? |
Chapter: 6
How does Policy Uncertainty affect Investment?
Overview
The chapter deals with policy uncertainty and its impact on investment and economic activity in the country and suggest policy recommendations for decoupling policy uncertainty in Indian economy.
Key Highlights
- Economic Policy Uncertainty (EPU) in India has reduced significantly over the last decade.
- Inspite of the increase in economic policy uncertainty in major countries, India has witnessed a continued decrease in economic policy uncertainty since 2015.
- EPU correlates strongly with the macroeconomic environment, business conditions and other economic variables that affect investment.
- Surges in economic policy uncertainty increases the systematic risk, and thereby the cost of capital in the economy
- Increase in EPU also dampens investment.
Economic Policy Uncertainty
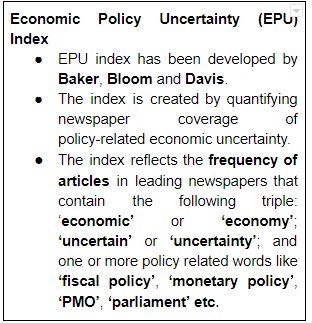
- The policy making relies on judgement which involves discretion and such discretion generates uncertainty which can impact economic activity.
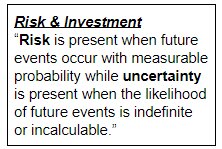
- To gauge the policy impact, it is critical to understand the difference between risk and uncertainty as both fundamentally affect the economic activity.
- Risk can be quantified while uncertainty is inherently hard to measure.
- However, advances in data analytics have made it possible to quantify uncertainty.
- Globally, an EPU index has been developed to measure economic policy uncertainty.
How Economic Policy Uncertainty affect Investment?
- Investment is forward-looking activity and future expectations plays a critical role in decision-making.
- Investors prefer to invest in projects with high returns and low risks.
- According to the Capital Asset Pricing model, the returns on investment correlates positively with the systematic risk.
- An increase in uncertainty in the economy increases this systematic risk and thereby increases the rate of return required to justify the investment.
- As a result, projects that generate a return lower than this required return become unviable when uncertainty increases in the economy.
- Also, as fixed investment is irreversible, uncertainty exacerbates risk aversion, increases the premium demanded for assuming risk, and eventually dampens investment.
Economic Policy Uncertainty in India
- As per the EPU Index, economic policy uncertainty peaked in India during the late 2011 and early 2012 and has since been declining with intermittent increases in between and peaking during taper tantrum period of 2013.
- In spite of increasing global uncertainty due to factors such as increasing trade tensions, Brexit, slower world growth; India’s economic policy uncertainty has been falling and is more stable.
- Global Financial Crisis had direct bearing on the fixed investment rate which fell from 37% in 2007-08 to 27% in the following 10 years and had recently improved to 28%.
- The continued resolution of the twin balance sheet problem following implementation of Insolvency and Bankruptcy Code 2016 and recapitalization of banks has helped to promote investment in the country.
Policy Recommendations
The following policy changes are recommended:
- First, policymakers’ must make their actions predictable, provide forward guidance on the stance of policy, and reduce ambiguity/arbitrariness in policy implementation.
- Second, “what gets measured gets acted upon”. So, economic policy uncertainty index must be tracked at the highest level on a quarterly basis.
- Finally, quality assurance of processes in policy making must be implemented in government via international quality certifications.
Keywords For Mains
|
Important Facts and Trends
|
Important Questions For Mains
|
Chapter: 7
India’s Demography at 2040: Planning Public Good Provision for the 21st Century
Overview
The chapter gave an insightful view of demography of India and projects the changes that are expected in the next two decades. It also laid out a future strategy to deal with demographic changes.
Key Highlights
- India will witness a sharp slowdown in population growth in the next two decades.
- India as a whole will enjoy the “demographic dividends” phase while some states will start transitioning to an ageing society by the 2030’s.
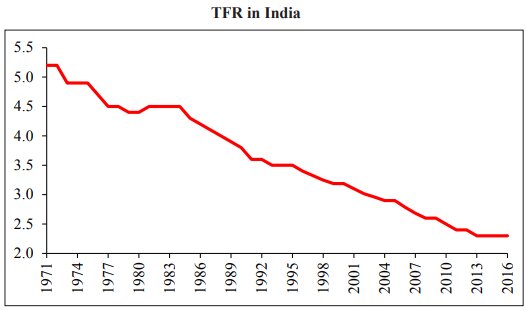
- Total Fertility Rate (TFR) had shown a steady decline since the mid 1980’s and expected to be below replacement level by 2021 (after adjusted for skewed gender ratio).
- India’s working age population will grow by roughly 9.7 million per year by 2021-31 and 4.2 million by 2031-41.
- The proportion of elementary school going children i.e 5-14 age group will witness a significant decline.
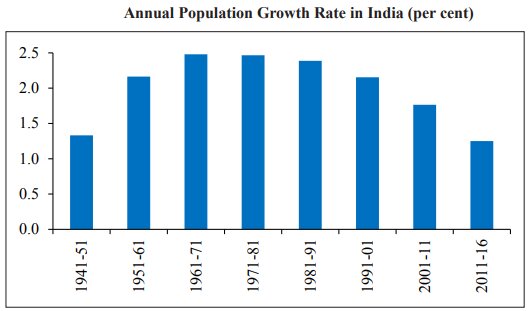
Recent Demographic Trends
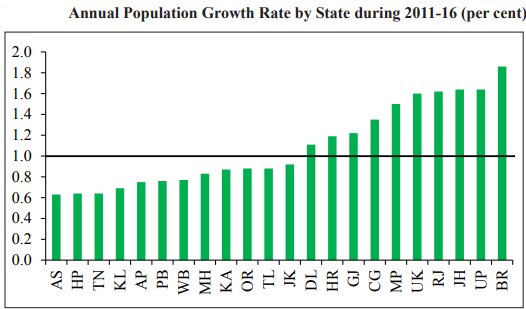
- Population growth in India has been slowing in recent decades from an annual growth rate of 2.5% during 1971-81 to an estimated 1.3% as of 2011-16 .
- All major states have witnessed a marked deceleration in population growth particularly high population growth states like Bihar, Uttar Pradesh, Rajasthan and Haryana.
- It has been mainly due to steady decline in India’s TFR which halved from 4.5 in 1984 to 2.3 as of 2016 and is now below replacement level by fertility in 13 out of the 22 major states which suggest that India has entered the phase of “demographic dividend”.
- Himachal Pradesh, Punjab, West Bengal and Maharashtra along with Southern states have made rapid advancement in demographic transition, with
- TFR already below replacement level fertility
- population growth mainly due to momentum
- more than 10% of the population over the age of 59 and
- at most one-third of the population below the age of 20.
Total Fertility Rate : It refers to the total number of children born or likely to be born to a woman of child-bearing age in her lifetime. It is highest for Bihar followed by UP and lowest for Delhi
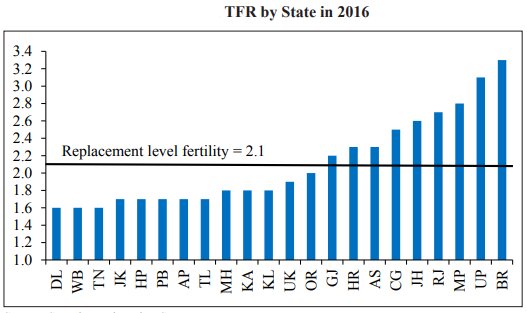
Replacement Level Fertility: TFR of 2.1 children per woman is called the replacement level fertility, which is the average number of children a woman would need to have in order for the population to replace itself.
Effective Replacement Level Fertility: Replacement Level Fertility adjusted for skewed sex ratio.
Projecting National and State Level Population (2021-2041)
Following projections and analysis has been done for 22 major states which accounts for 98.4% of India’s population as per Census 2011.
- Declining Fertility Rate
- National Level: TFR will continue to decline rapidly and will lie below replacement level fertility at 1.8 as early as 2021 and is expected to stabilize thereafter for some time at around 1.7.
- State Level: All states are expected to be below replacement level fertility by 2031.
- States such as WB, Punjab, Maharashtra, HP and southern states, which are already below replacement level are expected to reach lower level of 1.5-1.6.
- Sex Ratio: Sex ratio at birth remains higher than the normal range of 1.02-1.076 at the national level and in 17 out of 22 major states.
- The average value of sex ratio at birth is around 1.05, i.e. 105 boys born per every 100 girls which means that there are more males than females.
- This implies that the required replacement level fertility at the national and state level is higher than the usual benchmark of 2.1, i.e., due to the skewed sex ratio, a woman would have to give birth to more than 2.1 children in order for the population to replace itself.
- The effective replacement level fertility after accounting for skewed sex ratio could be around 2.15-2.2 for India with a sex ratio of 1.11
- Reason for Declining Fertility
- rising female education
- postponement of marriage
- access to family planning methods and
- continued decline in infant mortality.
- Population Growth Trajectory
- National Level: India’s population growth will continue to slow rapidly over the next two decades, growing less than 1% during 2021- 31 and under 0.5% during 2031-41. However, the positive population growth will be due to population momentum and the continued rise in life expectancy.
- State Level: States ahead in the demographic transition will see a continued deceleration in population growth and reach near-zero growth rates by 2031-41. Population will start declining in Tamil Nadu by 2031.
- States lagging behind in demographic transition will also witness a marked slowdown. Bihar and UP will account for over 40% increase.
- Changing Age Composition
- Young Population (0-19 year): It has started declining from 41% in 2011 and expected to reach 25% by 2041.
- Elderly Population (60 and above): It will rise steadily and expected to double from 8.6% in 2011 to 16% by 2041.
- India’s demographic dividend will peak around 2041, when the share of working-age, i.e. 20-59 years, population is expected to hit 59%.
- Implication for Working-Age Population
- India’s working-age population will rise by 96.5 million during 2021-31 and by 41.5 million during 2031-41.
- As per the NSSO Periodic Labour Force Survey 2017-18, India’s labour force participation rate for the age-group 15-59 years is around 53% (80% for males, 25% for females) and following this trajectory India needs to create jobs at the rate of 9.7 million per year during 2021-31 and 4.2 million per year during 2031-41.
- Working-age population will start declining in 11 out of the 22 major states during 2031-41, including in the southern states, Punjab, Maharashtra, West Bengal and Himachal Pradesh.
- It will continue to rise through 2041 in states lagging behind in the demographic transition, particularly Bihar, Uttar Pradesh, Madhya Pradesh and Rajasthan.
Policy Implication of Ageing
- Elementary Schools
- The number of school-going children (5-14 year) in India will decline by 18.4% between 2021 and 2041.
- The number of schools per capita will rise significantly in India across all major states even if no more schools are added.
- The states need to pay greater attention in consolidating/merging schools to make them viable rather than building new ones and states will need a policy shift from quantity to quality and efficiency of education.
- Healthcare Facilities
- The per capita availability of hospital beds will sharply reduce in India across all major states. India already fares poorly relative to other emerging and developed economies in terms of per capita availability of hospital beds.
- States which are in the advanced stage of demographic transition, greater provision of geriatric care are required due to rapidly changing age structure.
- Availability of specific data is the major hindrance in planning for the provision of medical facilities and will require a greater emphasis.
- Retirement Age
- India’s healthy life expectancy at the age of 60, which is the average number of years a 60-year old person is expected to live in full health taking into account the impact of diseases and injuries, has continually increased over the years for both men and women.
- The retiring workforce with increasing life expectancy is increasing the burden of pensions.
- Therefore, experience from other emerging and developed countries suggest that increasing retirement age would ease pressure on pension funding.
Important Facts and Trends
|
Important Questions For MainsQ1. How demographic changes are likely to impact economic scenario in the country. Q2. India's demographic dividends could be a boon or bane. Discuss the policy measures required to encash the benefits of demographic dividends? |
Chapter:8
From Swachh Bharat to Sundar Bharat via Swasth Bharat : An Analysis of the Swachh Bharat Mission
Overview
The chapter focuses on Gandhi's vision of clean India and highlights our phenomenal journey towards sanitation through Swachh Bharat Mission. The mission emphasizes on behavioural change as its key component and highlights its impact on various health outcomes.
Key Highlights
- The Swachh Bharat Mission (SBM) was initiated in 2014 to achieve universal sanitation coverage by October 2, 2019 i.e. 150th birth anniversary of Gandhiji.
- The flagship programme is the largest cleanliness drive as well as an attempt to effect behavioural change in the world ever.
- All over the country, around 9.5 crore toilets have been built and more than 5.6 lakh villages have been declared Open Defecation Free (ODF).
- Till June 2019, 30 States/ UT’s are 100% covered with Individual Household Latrine (IHHL).
- The evidence suggests that SBM has significantly improved health outcomes like reduced diarrhoea and malaria among children below 5 years, still-birth and low birth weight and these outcomes are more pronounced in districts where IHHL coverage was lower in 2015.
- Financial savings from a household toilet exceed the financial costs to the household by 1.7 times on average and 2.4 times for poorest households
- Poor sanitation costs India around 5.2 per cent of its GDP.
Swachh Bharat Mission-Gramin (SBM)
- Under SBM, an incentive of ₹12,000 is provided for construction of Individual Household Latrines (IHHL) to eligible beneficiaries in rural areas and covers for provision of water storage.
- A total of 51,314.3 crore has been allocated since 2014-15 for SBM, out of which, 48,909.2 crore (95.3%) has been released.
Multi-Facet Approach of SBM
- Community Participation: It promotes ownership and sustained use by financially involving beneficiaries/ communities.
- Flexibility in Choice: It provides flexibility to the poor/disadvantaged families to upgrade their toilets on the basis of their need and financial suitability.
- Capacity Building: It augments the institutional capacity of districts to change behaviour at the grassroot level and strengthen the capacities of implementing agencies so that the programme could be rolled in a time-bound manner and collective outcomes could be measured.
- Instil Behaviour Change: It provides incentives to State-level institutions to implement activities for behavioural change which emphasizes on awareness generation, triggering mind-set changes and demand generation for sanitary facilities in houses, schools, anganwadis, places of community congregation and for solid and liquid waste management activities.
- Broad-based Engagement: Swachh Bharat Kosh set up to encourage Corporate Social Responsibility and accept contributions from private organizations, individuals and philanthropists.
- Use of Technology: Many mobile applications have been launched to both government and private individuals to enable citizens to keep a check on the availability of toilets and nearly 90% of toilets have already been geo-tagged.
Outcomes of SBM
- Under SBM, around 98.9% of India has been covered.
- Open Defecation Free (ODF): Till May 2019, around 93.41% of villages and 88.41% (618) districts have been declared ODF.
- Goa has the lowest ODF coverage followed by Odisha, Telangana & Bihar while WB and Sikkim are close to 100% ODF coverage.
- Open Defecation Free (ODF): Till May 2019, around 93.41% of villages and 88.41% (618) districts have been declared ODF.
ODF would mean the termination of faecal-oral transmission and defined by
- no visible faeces found in the environment/village and
- every household as well as public/community institution(s) using safe technology option for disposal of faeces.
- Individual Household Latrines (IHHL): Most of the states have achieved the status of 100% IHHL coverage.
- Goa has lowest IHHL coverage followed by Odisha and Telangana.
- Behavioural Change: According to the National Annual Rural Sanitation Survey (NARSS) 2018-19, conducted by an independent Verification Agency (IVA) has found:
- 93.1% households had access to toilets
- 96..5% of households in rural India had access to toilets and use them.
- confirmed the ODF status of 90.7% of villages.
- Solid and Liquid Waste Management: Many states have undertaken various activities such as construction of waste collection centres, menstrual hygiene management activities, installation of bio-gas plants, construction of compost pits, installation of dustbins etc.
- Social Change: This mission acts as a driver for eliminating the gender disparity through the construction of gender-specific latrines in public areas such as schools, roads and parks.
- This public movement will have the indirect positive impact on society by increasing the enrolment ratio of girls in schools and improving health standards
- It is also aligned with the 2030 global sustainable development agenda and SDGs especially the SDG 6.2.
Analysis of SBM on Health Issues
- SBM has helped in reducing the diarrhoea and malaria among children below five years, still-birth and low birth weight (new-born with weight less than 2.5 kgs).
- Districts with low IHHL coverage suffered more from diarrhoea, malaria, still-birth and low birth weight as compared to districts with higher IHHL coverage.
Independent Studies
- The World Bank (2011) report estimates the economic impacts of inadequate sanitation in India in the year 2006 was around US$ 53 billion, implying a per capita annual loss of $48 or 6.4% of GDP
- The report “Sanitation Health Impact Assessment” conducted by the Ministry of Drinking Water and Sanitation (MoDWS), found that the health and nutritional indicators of the children and mothers belonging to the ODF areas were comparatively better than their non-ODF counterparts.
- The study “Swachh Bharat Mission – Preliminary estimations of potential health impacts from increased sanitation coverage” conducted by the World Health Organization (WHO) estimates a decline in diarrhoeal deaths attributable to unsafe sanitation from 1,40,000 in 2014 to 50,000 in 2017-18.
- Study conducted by UNICEF on behalf of the MoDWS that on an average, every household in an ODF village saved about Rs.50,000 an account of financial savings due to lower likelihood of disease from using a toilet and practicing hand washing and value of time saved due to closer toilets.
- When costs and benefits are compared over a 10-year time period, assuming 100% usability, the financial savings, time saving and benefits of life saved are included, the benefits to the households exceed the financial cost of constructing toilets by 4.7 times.
Way Forward
- SBM has led to a sea change in the dignity of people and has brought remarkable transformation of society as a whole but still a lot needs to be done.
- The dream of clean India can only be realized by addressing these multiple facets:
- maintaining a culture of swachhata at public places beyond individual houses
- cleaning water bodies
- scientific waste management
- dealing with plastic menace
- controlling air pollution, etc
- To sustain the momentum created and behavioural change, a number of actions would have to be taken on a continuous basis, such as:
- motivation of ‘agents of change’ at the ground level
- impart training to field agents
- appointment of sanitation ambassadors to campaign and create awareness especially on health benefits
- obtain systematic feedback from users.
- The availability of financial resources is also of utmost importance. Hence, there is a need to facilitate and sustain innovative financing mechanisms by exploring various financial instruments such as micro-financing, concessional loans, crowd funding etc.
Important Facts and Trends
|
Important Questions For MainsQ1. Mahatma Gandhi once said, “Sanitation is more important than independence.” Examine the relevance of this statement. Q2. The success of Swachh Bharat Abhiyan is more dependent on attitudinal change than financial resources. Discuss the steps taken by the government in this regard. |
Chapter: 9
Enabling Inclusive Growth Through Affordable, Reliable and Sustainable Energy
Overview
The Chapter provides insights about energy sector, especially renewable energy and discusses various issues related to electric vehicles penetration in India.
Key Highlights
- India lags behind significantly in energy usage, despite accounting for 18% of world’s population and uses only around 6% of the world’s primary energy.
- India has a per-capita energy consumption of only about one-third of the global average.
- The share of renewables in total generation has increased from 6% in 2014-15 to 10% in 2018-19.
- Access to energy directly affect various social indicators and contributes to Human Development Index (HDI).
- India, therefore, needs to quadruple its per-capita energy consumption to meet the rising aspirations of its citizens.
Energy For Prosperity
- Developed countries followed a path of energy-intensive industrial growth to reach the high standards of living.
- India’s per capita energy consumption equals 0.6 tonnes of oil equivalent (toe) as compared to the global per capita average of 1.8 toe.
- During initial phases of economic development, increase in per capita GDP requires a large increase in primary energy per capita.
- India cannot become an upper-middle-income country without:
- Rapidly raising its share of the global energy consumption commensurate with its share of the global population.
- Ensuring universal access to adequate modern commercial energy at affordable prices.
- India’s energy intensity of GDP started declining at a much lower level of per capita GDP as compared to the developed world and decrease in energy intensity is the reflective of increase in the efficiency of energy use.
- Access to energy is also important due to its linkages with other social indicators like the Sustainable Development Goal (SDG) No.7 on Affordable and Clean Energy.
- There is also a strong relationship between Human Development Index (HDI) and per capita energy consumption. A country with 100 Gigajoules of per capita energy consumption has, on an average, HDI of around 0.8, a very high human development. India had a per capita energy consumption of 24 Gigajoules and an HDI of 0.64 in 2017.
- Therefore, to enter the group of high human development countries, India needs to quadruple its per capita energy consumption.
Access To Energy- Energy Poverty
- In India, there is a wide disparity between urban and rural areas in access to energy as well as variation between households at different economic strata.
- There has been a considerable increase in LPG users, particularly in urban areas. A large proportion of the population, especially in rural areas relies on non-commercial biomass such as firewood and dung cakes, thereby exacerbating health concerns due to poor indoor air quality.
- As per National Survey (2011-12), around 81% of rural households and 59% of urban households in lowest five percentile classes of expenditure reported firewood and chips as their primary source of energy for cooking and as we climb up the economic strata ladder, their reliance on firewood and chips decreases and that of LPG increases.
- Even at the top five percentile classes in rural areas, only 50% use LPG which indicates that the problem of energy poverty has been more pervasive than income poverty.
- As per International Energy Agency (2018), in 2017, 53% of the population in India did not have access to clean cooking when compared with 68% in 2010.
- Government Efforts to increase LPG penetration:
- PM Ujjwala Yojana: It was launched in 2016 with the aim to safeguard the health of women and children by providing them with clean energy fuel. Under the scheme, around 7 Crore LPG connections have been provided till April 2019.
- Pahal Scheme: It is a direct benefit transfer scheme for LPG consumers launched to rationalize subsidies based on approach to cut subsidy leakages. It has been recognized by the “Guinness Book of World Record” as the World’s Largest Direct Benefit Scheme.
Energy Efficiency
- Along with increasing its energy production and consumption, ensuring access to electricity for all and improving living standards, India also strives to ensure that it follows a growth path that delivers sustainable development and protect the environment.
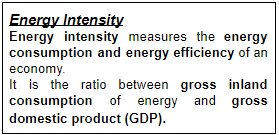
- India’s primary energy intensity of GDP has followed a declining trend and has fallen from 0.0004 toe in 1990 to 0.0002 toe in 2017.
- The institutional and legal framework in the country for energy efficiency has been strengthened through the Energy Conservation Act in 2001, which created the Bureau of Energy Efficiency (BEE). The overall size of the energy efficiency market in India is estimated to be US$ 22.81 billion.
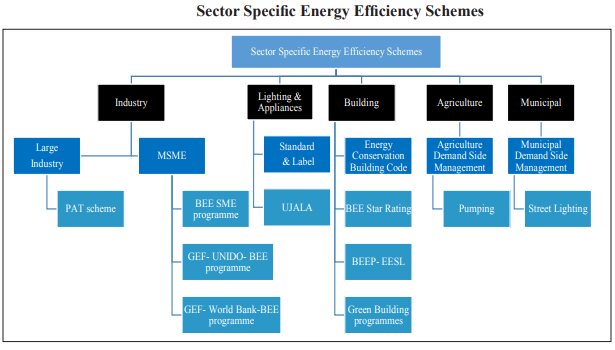
| Energy Efficiency Programs | |
| 1. Standards & Labelling Programme |
|
| 2. Energy Conservation Building Code (ECBC) |
|
| 3. Corporate Average Fuel Efficiency (CAFE) |
|
| 4. Demand Side Management Programme |
|
| 5. Perform, Achieve and Trade (PAT) Scheme |
|
| 6. Unnati Jyoti by Affordable LEDS for All (UJALA) |
|
Impact of Energy Efficiency Programmes
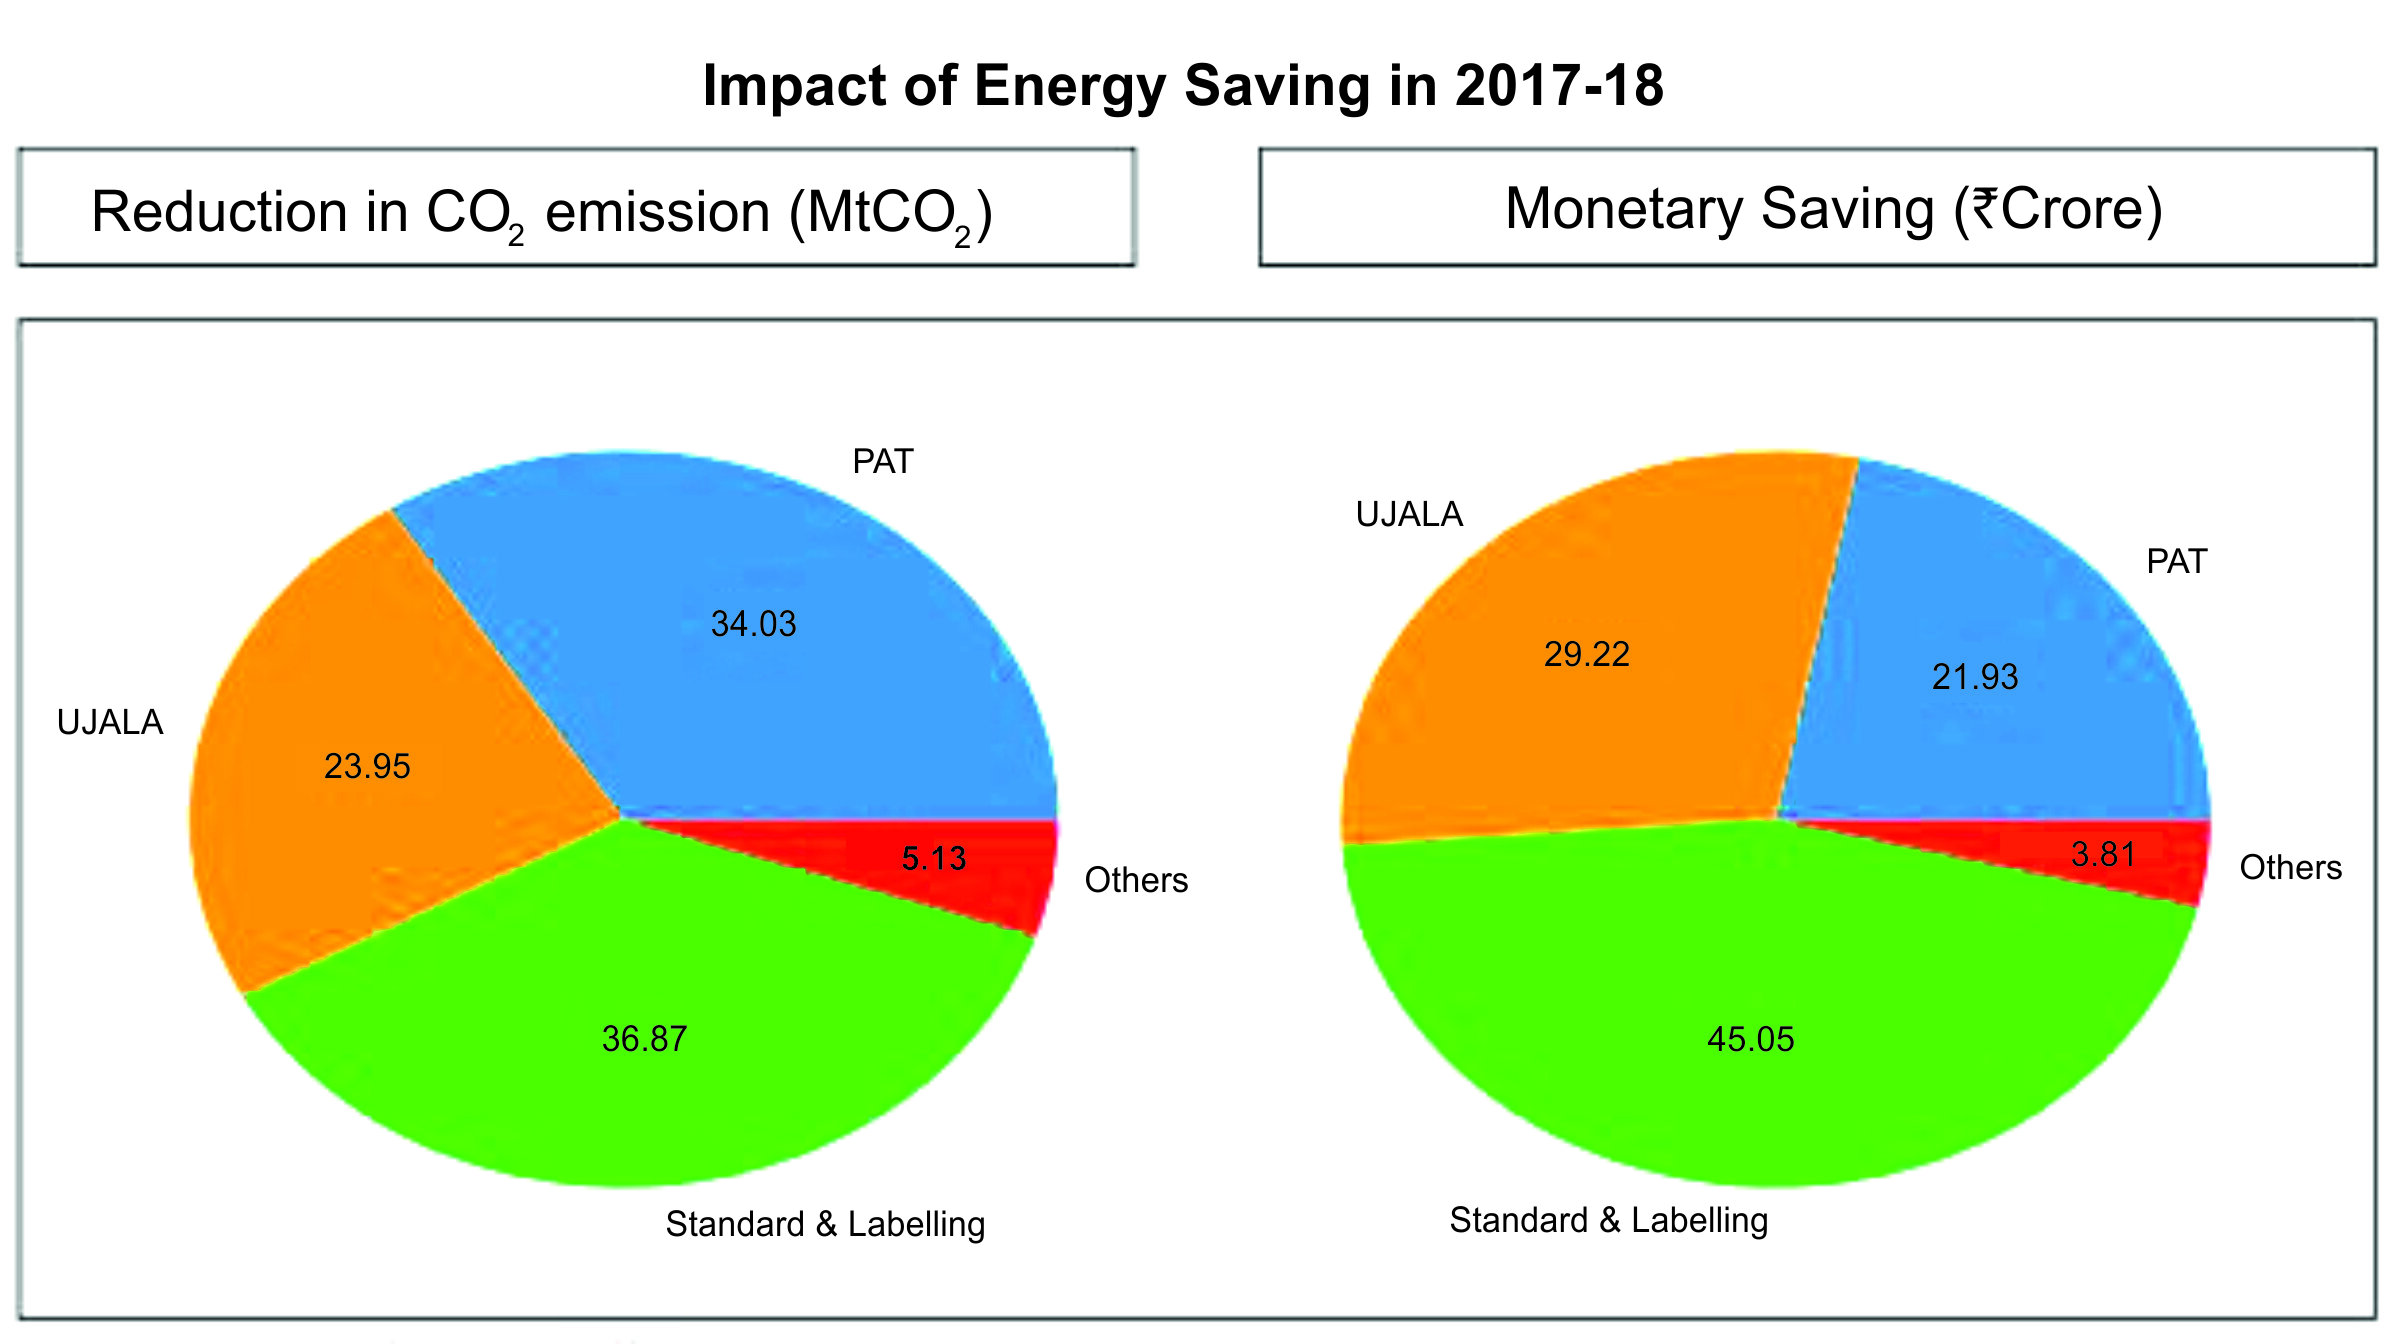
- Various energy efficiency programmes like Perform Achieve Trade (PAT), UJALA, Standards & Labelling etc have witnessed exceptional performance leading to lower greenhouse gas emissions and cost savings of Rs 53,000 Crore in 2017-18 and overall electricity savings due to energy efficiency measures is 7.21% of the net electricity consumption in 2017-18.
Saving Potential of Various Sectors
- According to BEE estimates, India’s energy saving potential stands at around 10% (moderate savings) to 15% (aspirational saving) by 2031. Industrial sector stands out with maximum energy saving potential.
Sustainability of Energy Generation
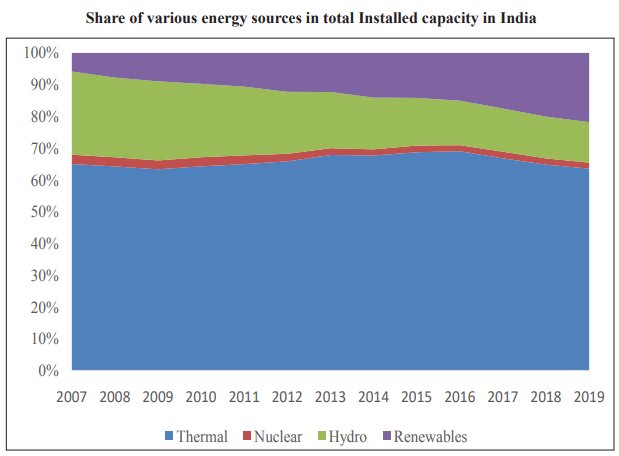
- According to IEA, the focus has been gradually shifting to non-fossil fuel sources for electricity generation but still the coal remains the largest source of electricity generation mix globally with 38% market share in 2018.
- It may not be advisable to effect a sudden abandonment of coal based power plants without complete utilisation of their useful lifetimes as it would lead to stranding of assets that can have further adverse impact on the banking sector.
- Global renewable generation capacity constituted around a third of total installed electricity capacity (IRENA, 2019).
- Almost 60% of India’s installed capacity is in thermal power particularly coal based thermal power plants. India’s Nationally Determined Contribution (NDC) under the Paris Agreement states that India will achieve 40% installed capacity of power from non-fossil fuels by 2030.
Potential of Renewable Energy
- Renewable energy sources are a strategic national resource and harnessing these resources is a part of India’s vision to achieve social equity and energy transition with energy security, a stronger economy, and climate change mitigation.
- Various financial incentives for off-grid and decentralized renewable energy system have progressively reduced cost and improved efficiency and reliability which have made renewable energy an attractive option for meeting the energy needs in a sustainable manner and helping India pursue its low carbon development pathway.
- India has been undertaking one of the world’s largest renewable energy expansion programmes in the world to achieve an installed capacity of renewable based power of 175 GW by the year 2022.
| Solar Sector | Hydro Sector | Wind Sector |
Initiatives Taken
|
Reforms in Hydro Sector
|
|
Electric Vehicles (EVs) in India
- Transport sector is the second largest sector contributor to CO2 emission after the industrial sector, out of which road transport accounts for 90% of the total emission in transport sector in India (MoEF&CC).
- Increasing vehicle ownership is resulting in huge oil imports. Therefore, shifting to electric mobility in road transport can lead to beneficial results.
Initiatives taken by Government
- National Electric Mobility Mission Plan 2020 (NEMMP): It was conceived with an objectives to achieve sales of 60-70 lakhs units of total EVs by 2020.
- Faster Adoption and Manufacturing of Electric Vehicles (FAME): It was launched to fast track the goals of NEMMP and FAME II, launched in April 2019, focuses on electrification of public transport.
EV’s Penetration in India
- Globally, the sales of electric cars have been rising at a fast pace and China accounts for more than half of the sales.
- India’s market share of electric vehicles is around 0.06% and U.P. topped the list among states with highest EV sales in 2017-18, followed by Haryana & Gujarat.
Issues with EV in India
- Charging Infrastructure: The market share of EVs is positively related to the availability of chargers therefore, it becomes important that adequate charging stations are made available throughout the road networks.
- Charging Time: The fast chargers can take around half an hour to charge an electric car while slow chargers could take even 8 hours. It is, therefore, an important policy issue to come up with universal charging standards for the country as a whole to enable increased investment in creation of such infrastructure.
- Batteries: The battery is the heart of any EV, development of appropriate battery technologies that can function efficiently in the high temperature conditions in India need to be given utmost importance.
It is important that these policies not only focus on reducing the upfront costs of owning an EV but also reduce the overall lifetime costs of ownership.
Way Forward
- Energy is the mainstay of the development process of any economy. Therefore India’s economic future and prosperity is dependent on her ability to provide affordable, reliable and sustainable energy to all her citizens.
Keywords For Mains
|
Important Facts and Trends
|
Important Questions For MainsQ1. “Energy poverty has been more pervasive in India than income poverty”. Examine the factors responsible and suggest the policy measures needed to tackle the scenario. Q2. Electric vehicles can be regarded as the future of transport sector. Critically analyse the growth of EV’s in India. |
Chapter: 10
Effective Use of Technology for Welfare scheme- Case of MGNREGS
Overview
The chapter deals with technological interventions taken by the government in course correcting the pathway for MGNREGS and has evaluated the impact of these interventions.
Introduction
- “Food for Work” is first referred in Kautilya’s Arthashastra and later in 1784, Nawab Asaf-ud-Daula started a “food for work” programme to help the famine-stricken people of Lucknow.
- The Mahatma Gandhi National Rural Employment Guarantee Act (MGNREGA), enacted through an Act of Parliament in 2005, represents the modern version of such “food for work” programmes in India.
- It was initiated to ameliorate rural distress by providing at least 100 days of manual labour at minimum wages to anyone who seeks employment. Creation of productive assets for prescribed quality and durability, social inclusion, gender parity, social security and equitable growth form the founding pillars of the programme
- During initial phases, MGNREGS had been saddled with several inefficiencies, including widespread corruption, political interference, leakage, and significant delay in wage payments. But post 2015 reforms used technology and emphasised on bringing in more transparency and accountability, robust planning and creation of durable productive assets.
Use of Technology in Implementing of MGNREGS
- Prior to DBT implementation, MGNREGS wages were transferred to the panchayat bank accounts and workers had to collect wages in cash from the gram panchayat office. But the government attempts to implement a system of DBT faced two serious constraints i.e unbanked population and verification of genuine beneficiary.
Steps Taken by Government to Counter Structural Constraints
- JAM Trinity i.e Jan Dhan, Aadhaar and Mobile enabled the role-out of DBT by streamlining the validation/ verification of beneficiaries as well as the process of release of funds.
- Jan Dhan: Pradhan Mantri Jan DhanYojana (PMJDY) was launched in 2015 to ensure universal access to banking facilities with at least one basic banking account for every household.
- Aadhaar: Aadhar enrollment exceeds 100 crore in 2015, thereby covering major portion of adult population and linking the unique aadhaar number to an active bank account was the key to implementing the income transfers.
- Mobile: It eases the connectivity issues by enabling people to access banking facilities using their mobile phones.
- National electronics Fund Management System (NeFMS)
- NeFMS was implemented in the year 2016 to streamline the system of fund flow and to ensure timely payment of wages.
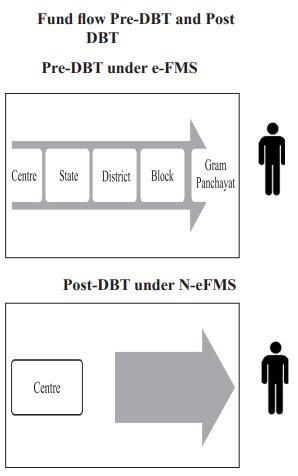
- Under the system, the Central Government directly credits the wages of the MGNREGS workers, on a real time basis, to a specific bank account opened by the State Governments
- NeFMS is implemented in 24 States and 1 Union Territory wherein payment of wages is being credited directly to the bank/post office accounts of MGNREGS workers by the Central Government.
- NeFMS was implemented in the year 2016 to streamline the system of fund flow and to ensure timely payment of wages.
- Aadhar Linked Payments (ALP)
- ALP could speed up the wage payment cycle in the following two ways.
- Ghost beneficiary elimination, thereby reducing time to verify and audit claims.
- Cutting the bureaucratic red tape by directly transferring wages to the bank accounts of beneficiaries by the Central Government.
- ALP could speed up the wage payment cycle in the following two ways.
Benefits of DBT
- Timely release of payments.
- Ensuring correct funds are transferred to correct beneficiaries, reducing corruption & leakages in the system.
- Reduction in delays in system for funds transfer (improving programme performance and instilling trust and confidence in the system by beneficiaries).
- Strong focus on security, tracking and monitoring of funds (through the use of digital sign/signatures and convergence/interoperability).
- Reconciliation process during payments between intermediate agencies involved in funds transfer (near real time tracking, accountability and transparency).
- Streamline the verification process and end to end funds release process in all the beneficiary oriented scheme.
- NREGAsoft: It is a local language enabled work flow based e-Governance system to capture all the activities under MGNREGS at Center/State/District/Block and Panchayat level.
- GeoMGNREGA: It uses space technology to develop a database of assets created under MGNREGS using technological interventions like mobile based photo geo-tagging and a GIS based information system for online recording and monitoring.
- Natural Resource Management (NRM) - Mission Water Conservation (MWC): It is the planned and systematic development of land to improve its productivity and harnessing of water through development of watersheds, have become the central focus of MGNREGS work across the country.
- It was made mandatory to spend 65% of total MGNREGS expenditure on NRM work which includes building check dams, trenches, ponds, renovation of traditional water bodies/tanks, dug wells etc.
- Mobile Apps like Gram Samvaad and JanMnREGA (an asset tracking and feedback app for MGNREGS assets) have been developed, which aim to empower the rural citizens by providing direct access to information and improve accountability to the people.
Impact of DBT on Effectiveness of MGNREGS
- Coverage: There was a significant increase in filled muster rolls (form of attendance) after the implementation of DBT which indicates that more people are reporting for work, especially vulnerable section i.e women, SCs & STs.
- Timely Payments of Wages: Post ALP, delay in payments has been reduced by one-third from around 35% to less than 10%. The NREGASoft monitors generation of payment of wages within 15 days.
- Demand for Work: Prior to implementation of ALP, the rural poor treated MGNREGS as an option to earn additional income during good times rather than a shock absorber during bad times. Post ALP, there was a reversal of trend, wherein an increase in demand for work under MGNREGS has been observed in drought affected areas.
- Reduction in delay of payments has an immediate positive effect on the demand of work in distressed areas.
- Supply of Work: The difference -in -difference estimate, i.e. the before- after difference in the blocks affected by drought versus the same difference in blocks not affected by drought, shows very little change due to implementation of ALP in the blocks not affected by drought.
- However, there was around 20% increase in the supply of work in blocks affected by drought.
- ALP has increased state capacity to implement anti-poverty programmes and can potentially bridge the demand supply gap in MGNREGS.
- Work Done under MGNREGS: The actual work done under MGNREGS increased significantly in blocks affected by drought due to the use of ALP. This increase was more than double the increase in blocks that were unaffected by drought.
Impact on Vulnerable Sections
- Post implementation of ALP, women, SC and ST workforce increased under MGNREGS during the times of economic distress.
Way Forward
- Probable Indicator of Distress: Real time indicators of distress at the district / panchayats level such as dashboards, can be created for flashing alerts for areas which are under local distress.
- Expansion of Work under MGNREGS: For increasing effectiveness of the scheme, the definition of ‘work’ should be regularly reviewed.
- Up-skilling the MGNREGS Workers: The focus needs to be on the diversification of livelihoods with multiple sources of income for them to come out of poverty.
- Expanding use of JAM to other Welfare Scheme: To make public spending more efficient and effective, the success of JAM trinity in MGNREGS has made a strong case for its implementation in other welfare scheme. JAM trinity has the proven potential to arrest the major loopholes i.e inclusion and exclusion errors.
- Use of Digital Infrastructure for Micro-Benefits: A huge digital infrastructure of JAM trinity can be used to expand the reach of programmes through provision of micro-insurance, micro-pensions and micro-credits to people in every corner of the country.
- Its wide use can lead to financial and economic inclusion benefitting the vulnerable and marginalized sections of the society.
Important Facts and Trends
|
Important Questions For MainsQ1. Mahatma Gandhi National Rural Employment Guarantee Act (MGNREGA) has played an important role in ensuring social justice in India. Discuss how technological and administrative initiatives have helped in the smooth rollout of MGNREGA. |
Chapter:11
Redesigning a Minimum Wage System in India for Inclusive Growth
Overview
- The chapter reviews the situation pertaining to minimum wages in India and suggests the way forward for rationalising and streamlining the policy for minimum wages.
Introduction
- The Mesopotamian code of ancient law i.e the Code of Hammurabi and the ancient Indian text of Arthashastra mentions minimum wages.
- Despite India’s outstanding growth in the last two decades, low pay and wage inequality remain serious obstacles towards achieving inclusive growth.
- Minimum wages promote social justice without any major negative implications for employment if wages are set at an adequate level.
- In recent times, Indian economy is fuelled by domestic consumption, which comprises of around 93% of workers in the informal sector therefore a well designed minimum wage system can reduce inequalities in incomes, bridge gender gaps in wages and alleviate poverty.
Minimum Wage System In India
- India was one of the first developing countries to introduce minimum wages but the whole minimum wage system in India is extremely complex with a plethora of issues.
- The Minimum Wage Act 1948: The Act protects both regular and casual workers and empowers both Central and State Governments to fix minimum wage rate for employees working in selected ‘scheduled’ employment.
- Minimum wages have been set for different categories of workers according to skill levels, location and occupations.
- The Act did not prescribe norms for fixing the level of the minimum wage.
- It provides for tripartite advisory boards consisting of employers, employees of scheduled employments, and independent persons to advise the Government in fixing minimum wages.
- The Minimum Wage Act 1948: The Act protects both regular and casual workers and empowers both Central and State Governments to fix minimum wage rate for employees working in selected ‘scheduled’ employment.
Steps Towards National Level Minimum Wage
National Level Minimum Wage has always been the debated idea due to the existence of wide disparities in economic development and large variations in cost of living between regions and states.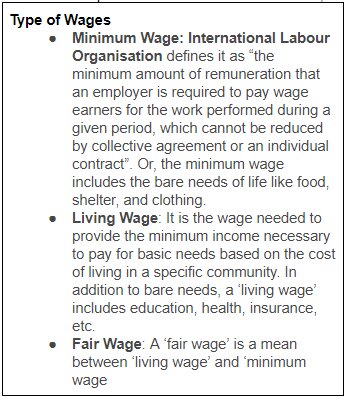
- The Indian Labour Conference (ILC) of 1957 recommended determining the minimum wage based on the principle of a household’s needs.
- The First National Commission on Labour (1969) recommended that National Minimum Wage is neither ‘feasible nor desirable’.
- The Bhoothalingam Committee (1978) argued for adoption of National Floor Level Minimum Wage (NFLMW) to ensure a uniform wage for all workers and eliminate arbitrariness in the determination of level of minimum wages for different States and occupations. Recommendations were mainly for the organised sector.
- The Labour Minister’s Conference (1988) made recommendations for linking minimum wage with the cost of living index, which became mandatory in 1991.
- The National Commision on Rural Labour (1991) recommended for a National Floor Level Minimum Wage as wide disparities were prevalent in minimum wages across States.
- In 1992, the Supreme Court of India ruled that minimum wage should also be linked with aspects such as children’s education, medical requirements etc.
- In 1996, the Central Government adopted non-statutory National Floor Level Minimum Wage (NFLMW) - Rs. 35 per day was notified. This NFLMW is updated regularly as per Consumer Price Index (CPI). NFLMW is Rs. 176 per day since 01.06.2017.
Complex Minimum Wage System in India
- Over the last 70 years, the minimum wage system in India has expanded and has become complex. The complexities arises from following issues:
- Number of Wage Categories: The present minimum wage system in India is extremely complex with 1,915 minimum wages defined for various ‘scheduled’ job categories for unskilled workers. This expansion in job categories and wage rates has led to variations not only across states but also within states.
- Lack of Uniform Criteria: In some states or in specific scheduled employments, minimum wages are linked to the cost of living, through a Variable Dearness Allowance (VDA) whereas other states do not include the VDA component.
- Variation among Regions: The number of scheduled employments varies from 3 in Mizoram to 102 in Assam. Similarly, the notified lowest minimum wage rate (per day) varies from Rs. 115 in Nagaland to Rs. 538 in Delhi.
- Vulnerable Categories: The Minimum Wages Act does not cover all wage workers. One in every three wage workers in India is not protected by the minimum wage law. Some major vulnerable categories – such as domestic workers – are presently covered only in 18 States and Union Territories.
Issues with Complex Minimum Wages
- Levels of Economic Development: The main justification for persisting with different levels of minimum wages across states is that they reflect different levels of economic development.
- Heterogeneous Labour Force: Multiple minimum wages usually exist to take care of the needs of a heterogeneous labour force. For example: The case of India and the Latin American Countries that have a high diversity of labourers.
- Gender Discrimination: An analysis of minimum wages for different occupations shows persistence of systematic bias. For example, domestic workers and security guards fall within the category of unskilled workers, but the minimum wage rate for domestic workers (dominated by women) within a state is consistently lower than that for security guards (dominated by men). Such differences can only be attributed to gender bias.
- Low Compliance: The proliferation of minimum wage rates and scheduled employments is a strong deterrent for compliance. Different statutory minimum wage rates for the same occupation between states can trigger migration of the industry to lower wage regions/state. Moreover, a complex system of minimum wages shows lack of coherence about wage levels and wages being set in an arbitrary fashion.
Impact of Minimum Wages
A well designed minimum wage system can have significant impact in reducing inequality and poverty complemented by other institutional mechanisms.
- Wage Levels: The minimum wage seems to have shaped wage bargaining i.e showed the presence of ‘lighthouse effect’, thereby leading to rise in actual wages. The studies suggests that increase in compliance in India showed the following effects:
- Stronger impact on male wages compared to female wages.
- Stronger impact on regular wages compared to casual wages.
- Wage Inequality: International experience suggests that greater compliance with minimum wages has led to the reduction in wage inequality. According to the International Labour Organisation (ILO) report, between 1993 and 2011, the average real wages increased in India with fastest growth recorded for casual labour, women’s labour and rural/agricultural labour. However, the existing wage inequality measured by the Gini Coefficient remains very high by international standards.
- The inequality has increased amongst regular workers and decreased among casual workers.
- Employment: Minimum wages have only a minimal (or no) impact on employment in emerging economies. A study suggests a positive effect of minimum wages on employment level for both men and women and finds that a 10% rise in minimum wages raised the employment level by 6.34% in rural areas having insignificant impact in urban areas.
Drishti Input
Report on Determining Methodology for Fixing National Minimum Wage
- Earlier in 2019, the seven-member expert committee under the Chairmanship of Dr. Anoop Satpathy had submitted its report on ‘Determining the Methodology for Fixation of the National Minimum Wage’.
- Apart from proposing a single national minimum wage at an all-India level, the report had also recommended different national minimum wages for different geographical regions. It, thus, had grouped the states into five regions.
- Key Recommendations
- Calorie Intake: Elaborate a nationally representative and culturally palatable food basket with focus on a balanced diet (comprising of calories, protein and fats) rather than merely its calorie intake.
- Set the minimum wage at a level that would allow for a minimum recommended intake (per adult person per day) of 2,400 calories, 50 grams of protein and 30 grams of fat.
- Non-Food Items: Ensure that the required expenditure of essential non-food items (namely clothing, fuel and light, house rent, education, medical, footwear, and transport) be equal to the median class of the expenditure distribution.
- Single Value: Set the single value of the NMW (National Minimum Wage) for India at Rs. 375 per day (or Rs. 9,750 per month), irrespective of sectors, skills, occupations and rural-urban locations.
- House Rent Allowance: Introduce an additional house rent allowance (city compensatory allowance), averaging up to Rs. 55 per day i.e., Rs. 1,430 per month for urban workers over and above the NMW.
- Region Based: Establish the NMW for five different regions with diverse socio-economic and labour market situations, ranging from a low of Rs. 342 per day (or Rs. 8,892 per month) to a high of Rs. 447 per day(Rs. 11,622 per month).
- Periodic Review: Review the consumption basket every five years, subject to the availability of NSSO-CES data, and revise the basic minimum wage in line with the consumer price index (CPI) every six months, to reflect changes in the cost of living.
- Calorie Intake: Elaborate a nationally representative and culturally palatable food basket with focus on a balanced diet (comprising of calories, protein and fats) rather than merely its calorie intake.
Way Forward
Policy recommendations for an effective design of minimum wages system are as follows:
- Simplification and Rationalisation: The Code on Wages Bill amalgamates the Minimum Wages Act, 1948, the Payment of Wages Act, 1936, the Payment of Bonus Act, 1965 and the Equal Remuneration Act, 1976 into a single piece of legislation. The definition of wages in the new legislation should subsume the present situation of 12 different definitions of wages in different Labour Acts.
- Setting a National Floor Level Minimum Wage: Central Government should notify a ‘national floor minimum wage’ that can vary across the five geographical regions. Thereafter, states can fix the minimum wage, which shall not be less than the ‘floor wage’. This would bring some uniformity across the country and would make all states almost equally attractive from the point of view of labour cost for investment as well as reduce distress migration.
- Criteria for Setting Minimum Wage: Further, the Code on Wages Bill should consider fixing minimum wages based on either of the two factors viz; (i) the skill category i.e unskilled, semi-skilled, skilled and highly skilled; and (ii) the geographical region, or else both. This key change would substantially reduce the number of minimum wages in the country.
- Coverage: The Code on Wages Bill should extend applicability of minimum wages to all employments/workers in all sectors and should cover both the organised as well as the unorganised sector.
- Regular Adjustment: A mechanism should be developed to adjust minimum wages regularly and more frequently, say, every six months. A dashboard needs to be set up which shows the date of the last revision in the minimum wage adjunct to the mandated period. This would enable dissemination of information and increased transparency in the system.
- Role of Technology: Information should be made available in a simple and clear manner with the help of technology. Use of a variety of online, mobile phone and networking technologies have the potential to facilitate the collection and analysis of labour statistics, assist with the dissemination of information about labour laws and policies, reduce costs and improve transparency. A national level dashboard can be created to provide updates regarding minimum wages. This portal must be made easily accessible so that the workers are well-informed and their bargaining skills and decision-making power are strengthened.
- Grievance redressal: There should be an easy to remember toll-free number for anybody to register his/her grievance on non-payments of the statutory minimum wages. Swift action should be taken against the offenders and this action should be flashed on the dashboard.
Keywords For Mains
|
Important Facts and Trends
|
Important Questions For MainsQ1. Despite India’s outstanding growth in the last two decades, low pay and wage inequality remain serious obstacles towards achieving inclusive growth. Discuss. |


