The distribution of Income in an economy is represented by the Lorenz Curve and the degree of income inequality is measured through the Gini Coefficient.
One of the five major and common macroeconomic goals of a government is the equitable (fair) distribution of income.
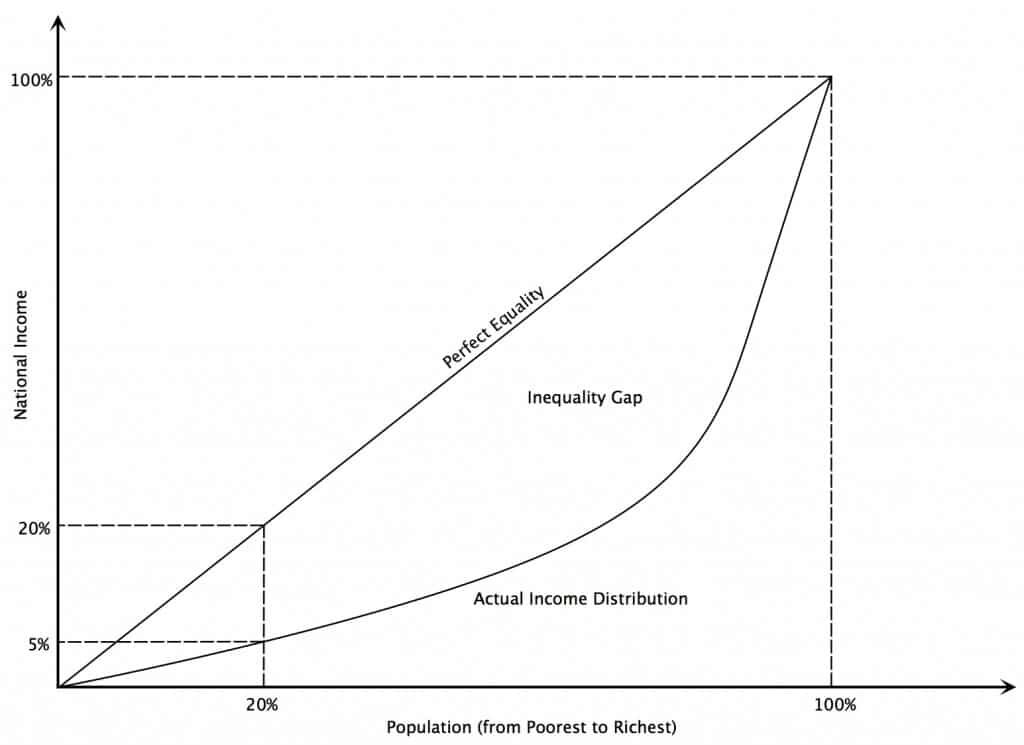
The Lorenz Curve (the actual distribution of income curve), a graphical distribution of wealth developed by Max Lorenzin 1906, shows the proportion of income earned by any given percentage of the population. The line at the 45º angle shows perfectly equal income distribution, while the other line shows the actual distribution of income. The further away from the diagonal, the more unequal the size of the distribution of income.
Gini Coefficient
The Gini Coefficient, which is derived from the Lorenz Curve, can be used as an indicator of economic development in a country.
The Gini Coefficient measures the degree of income equality in a population.
The Gini Coefficient can vary from 0 (perfect equality) to 1 (perfect inequality).
A Gini Coefficient of zero means that everyone has the same income, while a Coefficient of 1 represents a single individual receiving all the income.