Social Justice
Global Multidimensional Poverty Index MPI 2022
- 18 Oct 2022
- 6 min read
For Prelims: Global Multidimensional Poverty Index (MPI) 2022, United Nations Development Programme
For Mains: State of Poverty in India and Related steps taken
Why in News?
Recently, the Global Multidimensional Poverty Index (MPI) 2022 was released by the United Nations Development Programme (UNDP) and the Oxford Poverty and Human Development Initiative (OPHI).
What are the Key Highlights of the Index?
- Global Data:
- 1.2 billion people are multidimensionally poor.
- Nearly half of them live in severe poverty.
- Half of poor people (593 million) are children under age 18
- The number of poor people is highest in Sub Saharan Africa (579 million), followed by South Asia (385 million). The two regions together are home to 83% of poor people.
- 1.2 billion people are multidimensionally poor.
- Impact of Pandemic:
- The data do not, however, reflect post-pandemic changes.
- According to the report the Covid-19 pandemic could set back the progress made in poverty reduction globally by 3-10 years.
- The most recent data on food security from the World Food Programme suggest that the number of people living in food crises or worse increased to 193 million in 2021.
What are the Key Findings about India?
- Data:
- India has by far the largest number of poor people worldwide at 22.8 crore, followed by Nigeria at 9.6 crore.
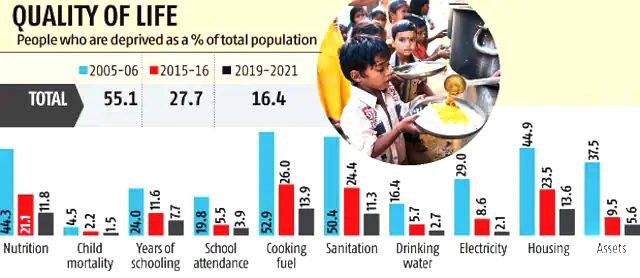
- Two-thirds of these people live in a household in which at least one person is deprived of nutrition.
- Reduction in Poverty:
- The incidence of poverty fell from 55.1% in 2005/06 to 16.4% in 2019/21 in the country.
- The deprivations in all 10 MPI indicators saw significant reductions as a result of which the MPI value and incidence of poverty more than halved.
- As many as 41.5 crore people moved out of poverty in India during the 15-year period between 2005-06 and 2019-21.
- Improvement in MPI for India has significantly contributed to the decline in poverty in South Asia.
- South Asia now has not the lowest number of poor people than Sub-Saharan Africa.
- The incidence of poverty fell from 55.1% in 2005/06 to 16.4% in 2019/21 in the country.
- Relative Reduction in Poverty:
- The relative reduction from 2015/2016 to 2019/21 was faster: 11.9% a year compared with 8.1% from 2005/2006 to 2015/2016.
- Performance of States:
- Bihar, the poorest state in 2015-16, saw the fastest reduction in MPI value in absolute terms.
- The percentage of poor in Bihar fell from 77.4 % in 2005-06 to 52.4 % in 2015-16 and further to 34.7 % in 2019-21.
- However, in relative terms, the poorest states have not quite caught up.
- Of the 10 poorest states in 2015/2016, only one (West Bengal) have emerged out of the list in 2019-21.
- The rest (Bihar, Jharkhand, Meghalaya, Madhya Pradesh, Uttar Pradesh, Assam, Odisha, Chhattisgarh and Rajasthan) remain among the 10 poorest.
- Across states and union territories in India, the fastest reduction in relative terms was in Goa, followed by Jammu and Kashmir, Andhra Pradesh, Chhattisgarh and Rajasthan.
- Bihar, the poorest state in 2015-16, saw the fastest reduction in MPI value in absolute terms.
- Poverty among Children:
- Poverty among children fell faster in absolute terms, although India still has the highest number of poor children in the world.
- More than one in five children in India are poor compared with around one in seven adults.
- Reduction of Poverty Region Wise:
- The incidence of poverty fell from 36.6% in 2015-2016 to 21.2% in 2019-2021 in rural areas and from 9.0% to 5.5% in urban areas.
What is the Global Multidimensional Poverty Index?
- About:
- The index is a key international resource that measures acute multidimensional poverty across more than 100 developing countries.
- It was first launched in 2010 by the OPHI and the Human Development Report Office of the UNDP.
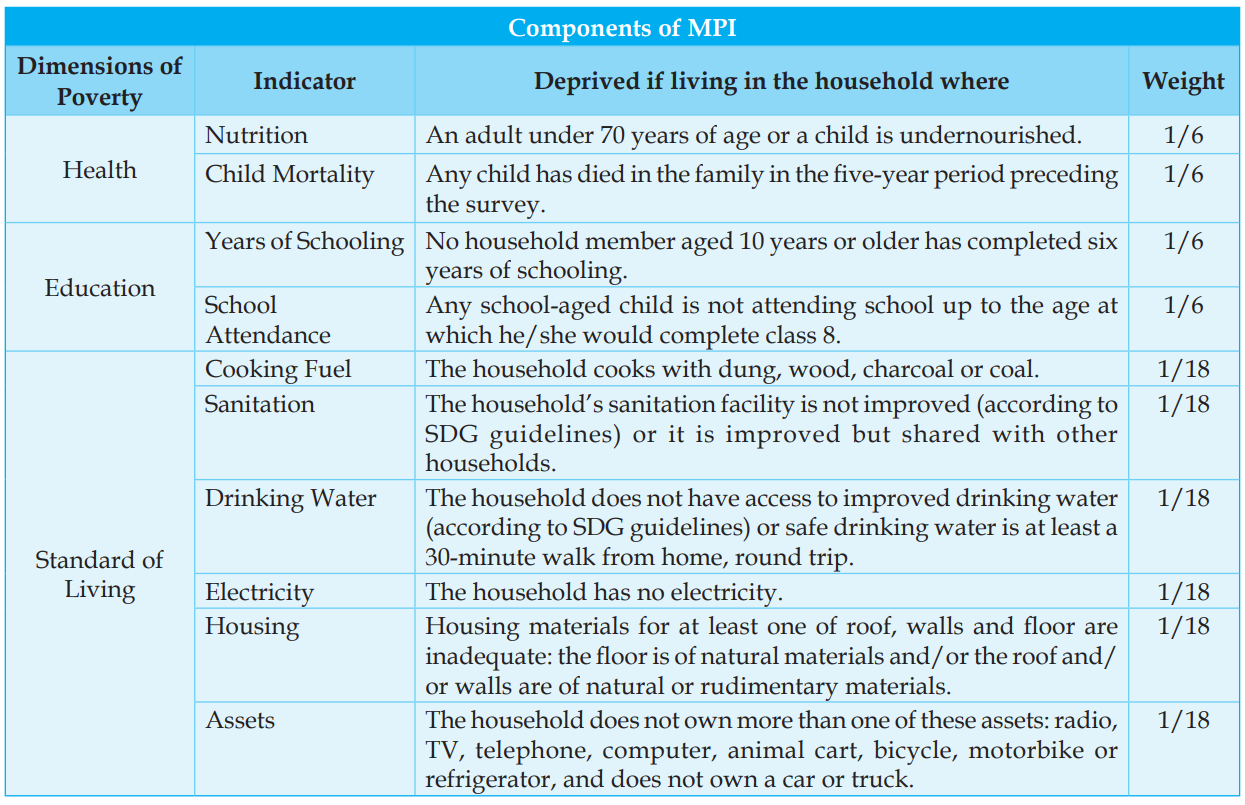
- The MPI monitors deprivations in 10 indicators spanning health, education and standard of living and includes both incidence as well as intensity of poverty.
- MPI Indicators and Dimensions:
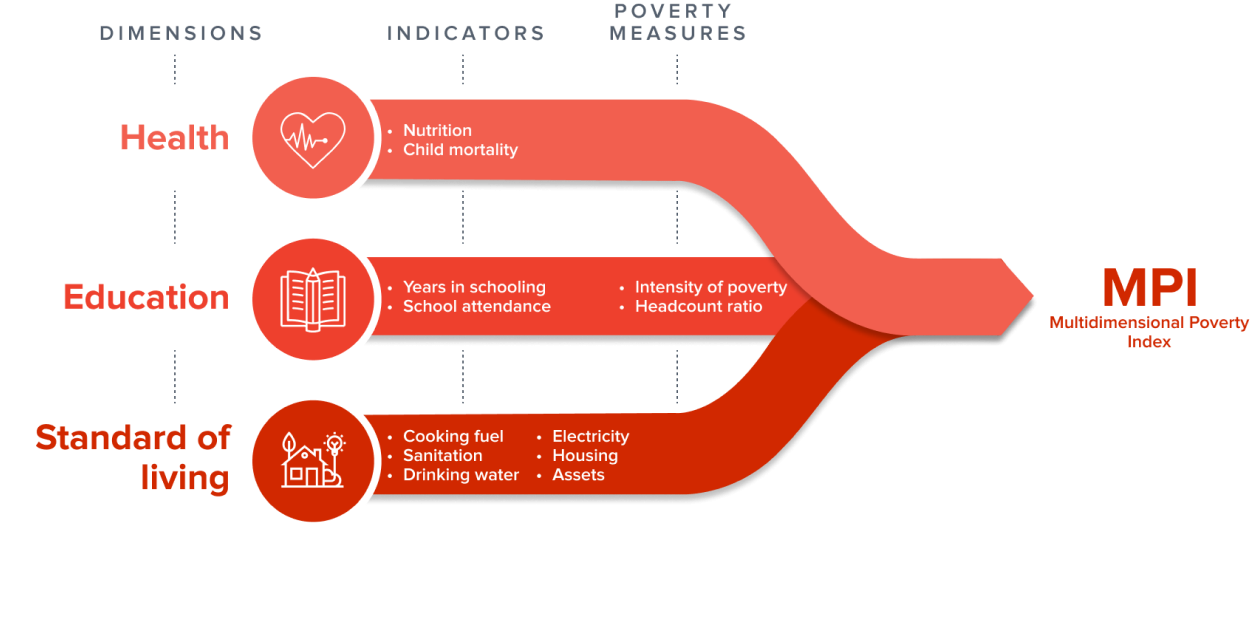
- A person is multidimensionally poor if she/he is deprived in one third or more (means 33% or more) of the weighted indicators (out of the ten indicators). Those who are deprived in one half or more of the weighted indicators are considered living in extreme multidimensional poverty.
UPSC Civil Services Examination Previous Year Question (PYQ)
Prelims
Q. The Multi-dimensional Poverty Index developed by Oxford Poverty and Human Development Initiative with UNDP support covers which of the following? (2012)
- Deprivation of education, health, assets and services at household level
- Purchasing power parity at national level
- Extent of budget deficit and GDP growth rate at national level
Select the correct answer using the codes given below:
(a) 1 only
(b) 2 and 3 only
(c) 1 and 3 only
(d) 1, 2 and 3
Ans: (a)
Exp:
- The Multidimensional Poverty Index (MPI) reflects the deprivations that a poor person faces simultaneously with respect to education, health and living standards, as reflected in the following table. Hence, statement 1 is correct.
- Therefore, option (a) is the correct answer.
Mains
Q. Despite Consistent experience of high growth, India still goes with the lowest indicators of human development. Examine the issues that make balanced and inclusive development elusive. (2016)


