Indian Economy
Gist of Economic Survey 2020-21
- 19 Mar 2021
- 94 min read
Chapter 1
Saving Lives and Livelihoods amidst a Once-in-a-Century Crisis
The COVID-19 pandemic engendered a once-in-a-century global crisis in 2020 – a unique recession where 90% of countries are expected to experience a contraction in GDP per capita. Faced with unprecedented uncertainty at the onset of the pandemic, India focused on saving lives and livelihoods by its willingness to take short-term pain for long term gain.
Key points
- The virus has posed an unprecedented challenge for policy making, globally and nationally as it tested the mettle of policymakers to deal with uncertain, fluid, complex and dynamic situations having far-reaching socio-economic implications.
- It has also tested the frontiers of medical science, which rose to the challenge by developing an effective vaccine within a year.
- The only strategy that seemed viable for containment of the pandemic was active surveillance, early detection, isolation and case management, contact tracing and prevention of onward spread by practising social distancing and safety precautions.
- These were aimed to slow down the transmission of infection or ‘flatten the epidemic curve’ and buy the health care system some time to handle the surge in demand for its services and for development of effective treatment and a vaccine.
- The world economy is estimated to contract in 2020 by 4.3%, as per the World Bank, and 3.5%, as per IMF.
- The pandemic is once in a 150-year event with an unprecedented impact with all regions in the world projected to experience negative growth in 2020. It is aptly called the ‘Great Lockdown’. The other pandemic that the world faced was almost a century ago that was Spanish Flu.
Lessons from the Spanish Flu
- The pandemic curve needs to be ‘flattened’ to spread the pandemic over time and enable more people to receive proper health treatment, thereby lowering the fatality rate ultimately.
- Given the network structures that affect the transmission of the pandemic, the higher population can lead to a faster spread of the pandemic.
- Denser areas are more vulnerable to faster spread of the virus and this effect is especially strong at the onset of the pandemic.
- Early lockdowns delay the time taken to reach the peak, reduce the magnitude of the peak, and thereby decrease the total mortality burden by providing valuable time to ramp up the health and testing infrastructure.
- Implementing lockdowns earlier in the pandemic and using them more intensely – while costly in the short-run – led to a much sharper economic recovery and reduced mortality as well.
- When faced with enormous uncertainty, policies must be designed with the objective of minimizing large losses by selecting the policy that would be optimal under the worst-case scenario.
Flattening the Curve
- Epidemiological research highlights that a key strategy to combat the spread of an epidemic is termed as “flattening the curve.”
- The curve refers to the projected number of people who will contract the disease in a given population.
- The shape of the curve varies according to the rapidity with which the infection spreads in the community.
- There is a “peak” of the disease, where the number of infected individuals reaches a maximum, followed by a decline.
- Policymakers care particularly about the time taken to reach this peak because this determines the time available to respond to early signs of a pandemic.
- Overloaded healthcare systems that are forced to operate beyond their capacity lead to higher case fatality rates.
- In the short run, the capacity of any country’s health system is finite (number of hospital beds, the number of skilled health professionals, ventilators/Integrated Care Units among others).
- This puts an upper bound on the number of patients that can be properly treated, at any given point of time.
- If the spread of the pandemic exceeds the existing capacity of the health system, it may lead to higher mortality rates.
- The ‘flattening of the curve’ spreads the pandemic over time, enabling more people to receive proper health treatment – ultimately lowering the fatality rate.
India’s Policy Response
- COVID-19, posited complex and multi-faceted health and socio-economic trade-offs for policymakers – whether to save ‘lives’ or ‘livelihoods’.
- Given that India is the second-largest populated country in the world with a high density, the transmission potential of COVID-19 was high.
- In the absence of a potent cure, preventive vaccine, the interplay of network structures in densely populated areas, and a high CFR, India weighed the costs and opportunities strategically.
- Given the ‘black swan event’ marked by sheer uncertainty and once in a century crisis, Indian policymakers followed an approach similar to the Barbell strategy in finance – hedging for the worst outcome initially, and updating its response step-by-step via feedback.
- The clear objective of ‘Jaan Hai to Jahan hai’ and to ‘break the chain of spread’ before it reaches ‘community transmission’ helped the government face the dilemma of ‘lives vs livelihood’, pace the sequence of policy interventions and adapt its response as per the evolving situation.
- The lockdown provided the necessary time to put in place the fundamentals of the '5 T' strategy - Test, Track, Trace, Treat, Technology.
- The districts across India, based on the number of cases and other parameters were classified into red, yellow and green zones. Across the country, ‘hotspots’ and ‘containment zones’ were identified – places with higher confirmed cases increasing the prospect of contagion.
Conclusion
Despite the hard-hitting economic shock created by the global pandemic, India is witnessing a V-shaped recovery with a stable macroeconomic situation aided by a stable currency, comfortable current account, burgeoning forex reserves, and encouraging signs in the manufacturing sector output. India is reaping the “lockdown dividend” from the brave, preventive measures adopted at the onset of the pandemic.
Chapter 2
Does Growth Lead to Debt Sustainability? Yes, But Not Vice-Versa!
Naturally, the debate around higher Government debt to support a fiscal expansion is accompanied by concerns about its implications for future growth, debt sustainability, sovereign ratings, and possible vulnerabilities in the external sector. It thus becomes unavoidable to examine the optimal stance of fiscal policy in India during a crisis and establish that the growth leads to debt sustainability in the Indian context and not necessarily vice-versa.
Key Points
- While the fiscal policy is especially salient during an economic crisis, in general, fiscal policy must be counter-cyclical to smooth out economic cycles instead of exacerbating them.
- While counter-cyclical fiscal policy is necessary to smooth out economic cycles, it becomes critical during an economic crisis.
- This is because fiscal multipliers, which capture the aggregate return derived by the economy from an additional Rupee of fiscal spending, are unequivocally greater during economic crises when compared to the economic slowdown.
- In advanced economies, where the public and private sector labour markets are not too segmented, fiscal spending can increase public sector employment, reduce the supply of labour in the private sector, bid up wages, and thereby crowd out private sector employment.
- However, in a country like India, where the private and public sector labour markets are largely segmented, such crowding out of private sector employment is minimal. Thus, debt-financed public expenditure is more cost-effective to employ during recessions than during economic booms.
NOTE
- Economic theory, in effect, makes a recommendation: in a recessionary year, Government must spend more than during expansionary times. Such counter-cyclical fiscal policy stabilizes the business cycle by being contractionary (reduce spending/increase taxes) in good times and expansionary (increase spending/reduce taxes) in bad times.
- On the other hand, a pro-cyclical fiscal policy is the one wherein fiscal policy reinforces the business cycle by being expansionary during good times and contractionary during recessions.
Business Cycle under Various Fiscal Policy Stances
- An expansion in Government expenditure can cushion the contraction in output by contributing to the GDP growth, by offsetting the decline in consumption and investment; and also by boosting private investment and consumption through higher spending multipliers during a recession.
- Through risk multiplier by compensating for greater risk-aversion of the private sector to bring back ‘animal spirits’.
- Governments adopting counter-cyclical fiscal policy are able to credibly exhibit their commitment to sound fiscal management. As a result, rational agents in the economy would expect the economy not to fluctuate as much and therefore their private actions would reinforce this, in turn enabling stronger macroeconomic fundamentals.
- For India, in the current scenario, when private consumption, which contributes to 54% of GDP is contracting, and investment, which contributes to around 29% is uncertain, the relevance of counter-cyclical fiscal policies is paramount.
| Fiscal Policy (FP) stance | Recession (↓ GDP) | Expansion (↑ GDP) | Outcome |
| Pro-cyclical |
Contractionary FP ↓ Govt. Expenditure or/and ↑ taxes |
Expansionary FP ↑ Govt. Expenditure or/and ↓ Taxes |
Deepens recessions and amplifies expansions, thereby increasing fluctuations in the business cycle. |
| Counter-cyclical |
Expansionary FP ↑ Govt. Expenditure or/and ↓ Taxes |
Contractionary FP ↓ Govt. Expenditure or/and ↑ Taxes |
Softens the recession and moderates the expansions, thereby decreasing fluctuations in the business cycle |
Debt Sustainability in India
- If the interest rate paid by the government is less than the growth rate, then the inter-temporal budget constraint facing the government no longer binds. This phenomenon highlights that debt sustainability depends on the “interest rate growth rate differential” (IRGD), i.e. the difference between the interest rate and the growth rate in an economy.
- Theory of debt sustainability: There are four key drivers to change in the ratio of government debt-to-GDP:
- the difference between the (real or nominal) interest rate charged on the government debt and (real or nominal) growth rates;
- the debt-to-GDP ratio in the previous period, and
- the ratio of primary deficit to GDP.
- The ease with which a government can reduce its debt-to-GDP ratio depends primarily on the interest rate-growth differential (IRGD).
- More negative the IRGD, the easier (and quicker) it is for the Government to ensure debt sustainability.
- Conversely, if the IRGD is positive, the harder (and slower) it is for the Government to ensure debt sustainability.
- A negative IRGD thus creates an enabling environment for debt sustainability.
- A closer look at the trends in the interest rate and growth rate in India highlights a perceptibly higher variability in the growth rates relative to interest rates over the past two-and-a-half decades.
- This implies that changes in IRGD are mostly attributable to changes in growth rates rather than the changes in interest rates. Thus, it is higher growth that provides the key to the sustainability of debt for India.
NOTE
- Primary Deficit refers to the difference between the current year's fiscal deficit and interest payment on previous borrowings. It indicates the borrowing requirements of the government, excluding interest.
In India, Growth Leads to Debt Sustainability and Not Vice-versa
- The arguments supporting higher debt leading to lower growth are as follows:
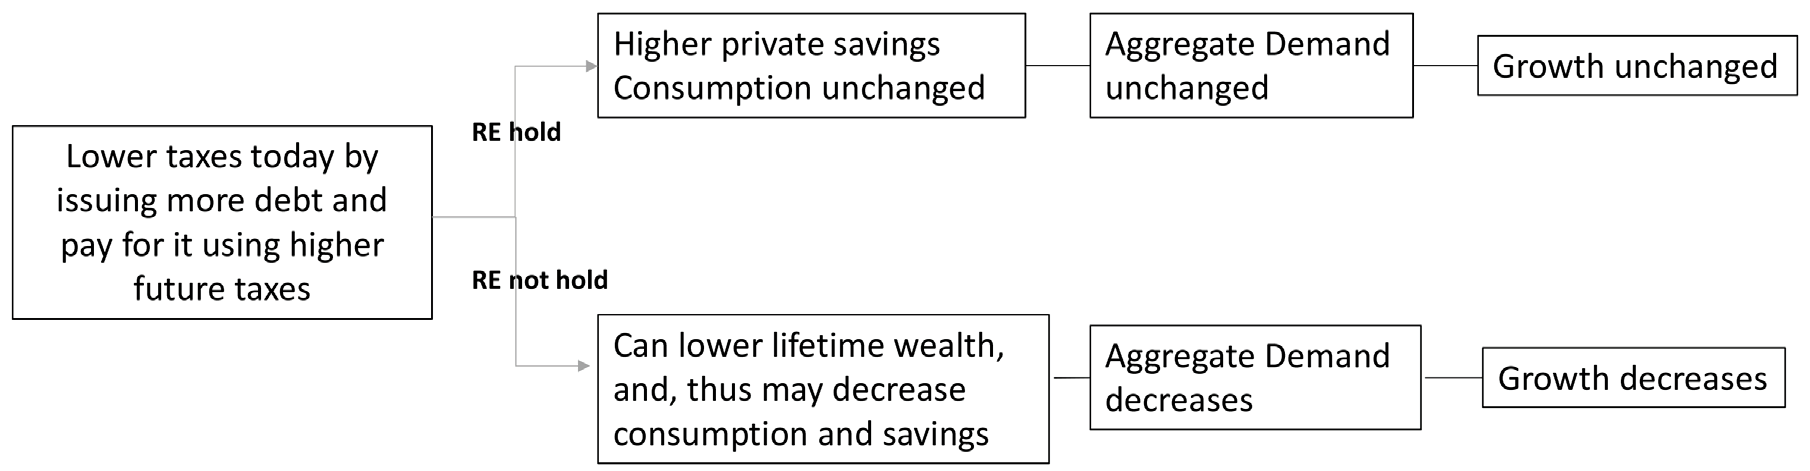
- Higher levels of public debt are accompanied by more taxes in the future to pay for the debt, thereby leading to lower lifetime wealth, which may decrease consumption and savings, eventually resulting in lower aggregate demand and growth rates.
- If higher public debt (i.e. lower public savings) is not accompanied by an increase in private savings, it may also lead to lower total savings in the economy. This may put upward pressure on the interest rates, resulting in crowding out of investment and thus negatively impacting the growth rates.
- Evidence over the last two-and-a-half decades demonstrates clearly that in India, higher GDP growth causes the ratio of debt-to-GDP to decline but not vice-versa.
- For countries growing their GDP at high rates, growth leads to lowering of their public debt as measured by their debt-to-GDP ratios but not vice versa. In contrast, when the GDP growth rate is low, no such causal relationship manifests between growth and public debt. This is seen through the following:
- For India and other Emerging Market Economies, which have consistently grown their GDP at high rates over the last few decades, the relationship between debt and growth exhibits a clear direction of causality: Higher growth lowers debt-to-GDP ratios but lower debt does not necessarily lead to higher growth.
- The same phenomenon is obtained during the high growth phases for the advanced economies, which have otherwise grown at significantly lower GDP growth rates when compared to India and other EMEs.
- In contrast, across both the high and low growth episodes, in the advanced economies, where GDP growth rates have been low on average over the last few decades, this relationship does not manifest.
NOTE
- Causality (also referred to as causation, or cause and effect) is influence by which one event, process, state or object (a cause) contributes to the production of another event, process, state or object (an effect) where the cause is partly responsible for the effect, and the effect is partly dependent on the cause.
Crowding Out Due to Public Expenditure
- So far, it is established that there is a clear direction of causality between growth and debt for countries where the growth rates are high; specifically, growth leads to debt sustainability and not vice versa in these countries.
- Conceptually, the possible link from higher incremental debt to lower growth rate is based on potential crowding out of private investment and the Ricardian Equivalence Proposition (REP).
- REP states that forward-looking consumers, who are also assumed to be perfectly rational and perfectly capable, internalize the government’s fiscal choices when making their consumption decisions.
- Specifically, for a given pattern of government spending, increases in government spending (or lowering of taxes) in the current period lead forward-looking consumers to anticipate future tax increases, thereby leading them to save in the current period to be able to pay for the future tax increases and aggregate demand remains unchanged in the current period.
- When REP does not hold, for instance, due to proportional taxes, higher public debt levels (lower public savings) may not be accompanied by an increase in private savings, higher government spending (or lower taxes) in the current period may lead to lower national savings. This may put upward pressure on the interest rates, resulting in crowding out of investment and thus negatively impacting the growth rates.
- The phenomenon of crowding out of private investment is based on the notion that the supply of savings in the economy is fixed. Therefore, higher fiscal spending may increase the demand for loanable funds and hence exert an upward pressure on interest rates, thereby discouraging private investment.
- However, for emerging economies such as India, an increase in public expenditure in areas that boost the private sector’s propensities to save and invest, may enable private investment rather than crowding it out.
- In other words, in an economy that has unemployed resources, an increase in government spending increases the aggregate demand in the economy, which may induce the private sector to increase their investment in new machinery to cater to the increased demand, and hence put the unused resources to productive uses.
- This may have multiplier effects on aggregate demand, resulting in higher growth rates.
- Thus, in an economy operating below full capacity, the supply of savings may grow from greater government spending through demand creation and thereby greater employment. It is also highlighted by recent research, favourable demographics – in the form of a large population of working age – would enhance savings through meaningful jobs.
Structure of India’s Debt
- India’s public debt-to-GDP has been significantly low compared to high global debt levels and moreover, public debt and overall debt level for India has declined since 2003 and has been stable since 2011.
- The Government’s debt portfolio is characterized by very low foreign exchange risk as the external debt is only 2.7% of GDP (5.9% of total Central Government liabilities).
- The long maturity profile of India’s public debt (issuance of longer tenure bonds) along with a small share of floating rate debt (floating rate debt of the Central Government is less than 5% of public debt) tends to limit rollover risks, and insulates the debt portfolio from interest rate volatility.
Policy Implications
- To eliminate the possibility of growth being impacted in the medium to long run, the Government has been extremely proactive in launching several seminal reforms.
- To ensure that the economy remains in good health to avail the full benefit of these significant reforms, the “economic bridge” to the medium and long-term has to be created. Only an active fiscal policy – one that recognises that the risks from doing too little are much more than the risks from doing too much – can ensure that this “economic bridge” is well laid out.
- With the IRGD expected to be significantly negative for India in the foreseeable future, pro-cyclical fiscal policies may lead to higher, not lower, debt/GDP ratios.
- During economic crises, a well-designed expansionary fiscal policy stance can contribute to better economic outcomes in two ways.
- First, it can boost potential growth with multi-year public investment packages that raise productivity.
- The multi-year nature of public investment would contribute to credibly lifting growth expectations.
- At a time of excessive risk aversion in the private sector, which is characteristic of any economic crisis, risk-taking via public investment can catalyse private investment and unleash a virtuous circle.
- It will crowd in private investment, rather than crowd it out.
- Second, there is a risk of the Indian economy falling into a low wage-growth trap, as has happened in Japan during the last two decades.
- Therefore, a practical fiscal rule should provide wriggle room for fiscal policy to be countercyclical by setting the trigger as a two-quarter slowdown in GDP growth of 3.5% when compared to the average GDP growth over the previous 20 quarters.
Conclusion
The call for a more active, countercyclical fiscal policy is not a call for fiscal irresponsibility. It is a call to break the intellectual anchoring that has created an asymmetric bias against fiscal policy. Once growth picks up in a sustainable manner, it will be the time for fiscal consolidation. But, for now, fiscal policy will have to remain centre-stage to support growth in the foreseeable future.
Chapter 3
Does India’s Sovereign Credit Rating Reflect its Fundamentals? No!
Credit ratings map the probability of default and therefore reflect the willingness and ability of the borrower to meet its obligations. India’s willingness to pay is unquestionably demonstrated through its zero sovereign default history. Despite this compelling statistic, India is an inexplicable outlier in its ratings cohort that highlights bias and subjectivity in sovereign credit ratings, especially against countries with lower ratings.
Sovereign Credit Ratings
- Sovereign credit ratings seek to quantify the issuers’ ability to meet debt obligations. When favourable, these can facilitate countries access to global capital markets and foreign investments. Major credit rating agencies (CRAs) around the world are Fitch, Moody’s and Standard and Poor’s, etc.
- Sovereign credit ratings broadly rate countries as either investment grade or speculative grade, with the latter projected to have a higher likelihood of default on borrowings.
Sovereign Credit Ratings and India
- Currently, India is rated investment grade by three major CRAs – S&P, Moody’s and Fitch. India, which is the fifth-largest economy in the world, has been rated as the lowest rung of the investment grade (BBB-/Baa3).
- Within its sovereign credit ratings cohort – countries rated between A+/A1 and BBB-/Baa3 – India is a clear outlier on several parameters i.e. a sovereign whose rating is significantly lower than mandated by the effect on the sovereign rating of the parameter.
- These include GDP growth rate, inflation, general government debt (as % of GDP), cyclically adjusted primary balance (as % of potential GDP), current account balance (as % of GDP), political stability, rule of law, control of corruption, investor protection, ease of doing business, short-term external debt (as % of reserves), reserve adequacy ratio and sovereign default history.
- The outlier status remains true not only now but also during the last two decades.
- India has consistently been rated below expectation as compared to its performance on various parameters during the period 2000-20.
- India’s willingness to pay is unquestionably demonstrated through its zero sovereign default history.
- India’s ability to pay can be gauged not only by the extremely low foreign currency-denominated debt of the sovereign but also by the comfortable size of its foreign exchange reserves that can pay for the short term debt of the private sector as well as the entire stock of India’s sovereign and non-sovereign external debt.
Effect of These Ratings on Select Indicators
- As ratings do not capture India’s fundamentals, it comes as no surprise that past episodes of sovereign credit rating changes for India have not had major adverse impacts on select indicators such as Sensex return, foreign exchange rate and the yield on government securities.
- Rating downgrade
- Ratings downgrade, on average, do not appear to have a strong negative correlation with Sensex return and exchange rate (INR/USD) in the short, medium and long term.
- G-Sec yields and spread, on average, do not appear to be negatively correlated with ratings downgrades in the medium term.
- Rating upgrade
- Threshold upgrades were correlated with an increase in Sensex returns in the medium term and with FPI (Equity and Debt) in the long term.
- Exchange rate (INR/USD), on average, appreciated by around 1.5% over the previous year during the rating upgrade.
- During ratings upgrade, yield on G-Sec (5 year), on average, increased by 0.2% over the previous month, and grew at 0.6% over the next six months. Yield on G-Sec (10 year), on average, fell by 0.5% over the previous month, and grew at an average rate of 0.7% over the next six months.
NOTE
- A spread (in government bonds) is the difference between yields on differing debt instruments of varying maturities, credit ratings, issuer, or risk level, calculated by deducting the yield of one instrument from the other.
Policy Implications
- It is questionable whether India’s sovereign credit ratings reflect its fundamentals. Moreover, there is evidence of a systemic under-assessment of India’s fundamentals as reflected in its low ratings over a period of at least two decades.
- India’s fiscal policy should be guided by considerations of growth and development rather than be restrained by biased and subjective sovereign credit ratings.
- While sovereign credit ratings do not reflect the Indian economy’s fundamentals, noisy, opaque and biased credit ratings damage FPI flows.
- Developing economies must come together to address this bias and subjectivity inherent in sovereign credit ratings methodology to prevent exacerbation of crises in future.
Conclusion
The pro-cyclical nature of credit ratings and its potential adverse impact on economies, especially low-rated developing economies must be expeditiously addressed. India has already raised the issue of pro-cyclicality of credit ratings in G20. In response, the Financial Stability Board (FSB) is now focusing on assessing the pro-cyclicality of credit rating downgrades.
Chapter 4
Inequality and Growth: Conflict or Convergence?
There is a potential conflict between economic growth and inequality. Could the fact that both the absolute levels of poverty and the rates of economic growth are low in advanced economies generate this conflict? If so, could it be that a developing economy such as India can avoid this conflict because of the potential for high economic growth, on the one hand, and the significant scope for lifting millions out of poverty, on the other hand? This question becomes pertinent especially because of the inevitable focus on inequality following the COVID-19 pandemic.
Key Points
- The previous economic survey argued that the ethical wealth creation – by combining the invisible hand of markets with the hand of trust – provides the way forward for India to develop economically.
- An often repeated concern expressed with this economic model pertains to inequality and some people, especially in advanced economies post Global Financial Crisis, argue that inequality is no accident but an essential feature of capitalism.
- The significant reduction in poverty that high economic growth has delivered in India and China presents the most striking challenge to this notion of conflict between economic growth and inequality.
- The advanced economies may choose to focus on alleviating inequality given their stage of development, their potential rate of economic growth and the absolute levels of poverty that they face. Thus, they may resolve the trade-off between growth and inequality by leaning towards alleviating inequality.
- However, despite facing the same trade-off, the policy objective of focusing on inequality may not apply in the Indian context given the differences in the stage of development, India’s higher potential rate of economic growth and the higher absolute levels of poverty.
- Thus, unlike in advanced economies, in India, economic growth and inequality converge in terms of their effects on socio-economic indicators and economic growth has a far greater impact on poverty alleviation than inequality.
Inequality or Poverty
- Inequality needs to be distinguished from poverty.
- Inequality refers to the degree of dispersion in the distribution of assets, income or consumption.
- Poverty refers to the assets, income or consumption of those at the bottom of the distribution. Poverty could be conceptualised in relative terms or in absolute terms.
- People feel themselves to be poor and think others to be poor if they have substantially less than what is commonplace among others in their society. Poverty, in this view, is relative deprivation.
- If poverty is conceptualized in relative terms, there is no need to distinguish it from inequality. A relative measure of poverty is indeed a measure of inequality.
- On the other hand, if poverty is conceptualized in an absolute sense, that is, focusing on the absolute levels of assets, income or consumption of those at the low end of the distribution, then increases in inequality may be accompanied by a reduction in poverty.
- For instance, experiments in which five or so participants are placed in a situation approximating Rawls’ “original position,” most participants do not choose based on this distributive principle.
- Instead, they choose a principle in which the average income is maximized with a floor under the incomes of those at the bottom.
- In this view, as long as the poor have “adequate” incomes, an increase in the incomes of the rich need not benefit the poor to be considered just.
- The results of such experiments suggest that (absolute) poverty should be of greater concern than inequality.
- In this context, the evidence against the conflict between inequality and income per capita among the Indian states suggests that at the level of development that India is currently in, the focus on poverty alleviation through growth must be central to India’s economic strategy.
Original Position
- The idea was developed by John Rawls, who argued that the most reasonable way to decide upon a fair distributive principle is to imagine that you must make this decision knowing you will be born into the world but not knowing anything about what your assets and characteristics ⎯ intelligence, personality traits, parents, neighbourhood, gender, skin colour, etc. - will be.
- In other words, you are asked to consider which principles you would select for the basic structure of society, but you must select as if you had no knowledge ahead of time what position you would end up having in that society.
- Rawls’s distributive principle is a “maximin” one: whatever distribution maximizes the income of the poorest (and provides basic liberties) is to be preferred.
Relative Impact of Economic Growth and Inequality in India
- Analysis of the relationship between income and poverty, suggests an overall strong negative relationship, implying that the states with greater income or high per capita Net State Domestic Product (NSDP) experienced low rates of poverty and vice versa.
- However, such a strong relationship is absent between inequality and poverty.
- Impact of economic growth on poverty can also be analysed on the basis of the information on multidimensional poverty headcount ratio from Global Multi-dimensional Poverty Report.
- MPI is based on three dimensions – education, health and standard of living – using ten indicators viz; education attainment, year of education; nutrition and mortality; and electricity, drinking water, sanitation, cooking gas, housing, and assets.
- Headcount ratio (HCR) counts persons as multi-dimensionally poor if their composite score is more than 0.33. The HCR of MPI is interpreted as the proportion of the population that is multi-dimensionally poor.
- States that witnessed a large reduction in poverty, using the official estimates based on consumption, experience proportional reductions in multi-dimensional poverty as well. Thus, the association between MPI and poverty has been positive.
- The pattern of growth has changed significantly after 1991. Poverty is concentrating more and more in urban areas, as now one-in-three poor people are living in urban areas, which was about one-in-eight in the early 1950s.
- In the post-liberalisation period, urban growth and non-agricultural growth has emerged as a major driver of national poverty reduction including rural poverty.
Conclusion
The relationship between inequality and socio-economic outcomes, on the one hand, and economic growth and socio-economic outcomes, on the other hand, is different in India from that observed in advanced economies. Unlike in advanced economies, in India economic growth and inequality converge in terms of their effects on socio-economic indicators. Furthermore, economic growth has a far greater impact on poverty alleviation than inequality. In sum, for a developing country such as India, where the growth potential is high and the scope for poverty reduction is also significant, the focus must continue on growing the size of the economic pie rapidly at least for the foreseeable future.
Chapter 5
Healthcare Takes Centre Stage, Finally!
The health of a nation depends critically on its citizens having access to an equitable, affordable and accountable healthcare system. The recent COVID-19 pandemic has emphasised the importance of the healthcare sector and its inter-linkages with other key sectors of the economy. The ongoing pandemic has showcased how a healthcare crisis can get transformed into an economic and social crisis.
Key Points
- Increased prioritization of healthcare in government budgets is important as it crucially impacts how much protection citizens get against financial hardships due to out-of-pocket payments (OOP) made for healthcare.
- OOP for health increases the risk of vulnerable groups slipping into poverty because of catastrophic health expenditures and it needs to be averted.
- Health affects domestic economic growth directly through labour productivity and the economic burden of illnesses.
- Increasing life expectancy from 50 to 70 years (a 40% increase) could raise the economic growth rate by 1.4 percentage points per year. Life expectancy in a country correlates positively with per-capita public health expenditure.
- Maternal mortality correlates negatively with increases in per-capita public health expenditure.
India’s Healthcare Scenario
- Despite improvements in healthcare access and quality (healthcare access and quality scored at 41.2 in 2016, up from 24.7 in 1990), India continues to underperform in comparison to other Low and Lower Middle Income (LMIC) countries.
- On quality and access of healthcare, India was ranked 145th out of 180 countries (Global Burden of Disease Study 2016). Only a few sub-Saharan countries, some pacific islands, Nepal and Pakistan were ranked below India.
- At 3-4%, the hospitalisation rates in India are among the lowest in the world; the average for middle-income countries is 8-9% and 13-17% for OECD countries (OECD Statistics).
- Given the increasing burden of Non-Communicable Diseases (NCD), lower life expectancy, higher Maternal Mortality Rate (MMR) and Infant Mortality Rate (IMR), the low hospitalisation rates are unlikely to reflect a more healthy population as compared to middle income or OECD countries.
- Thus, the low hospitalisation rates reflect lower access and utilisation of healthcare in India.
- India has one of the highest levels of Out of Pocket Expenditure (OOPE) in the world.
- India ranks 179th out of 189 countries in prioritization accorded to health in its government budgets.
- This prioritisation of health in India is similar to donor-dependent countries such as Haiti and Sudan, and well short of its peers in development.
- Although aggregate human resources for health density in India is close to the lower threshold of 23, the skill mix (doctor/nurse-midwives ratio) is far from adequate.
Unregulated Private Enterprise in Healthcare
- While the share of public institutions has increased both in hospital and outpatient cares, the private sector dominates in total healthcare provision in India. Around 74% of outpatient care and 65% of hospitalisation care is provided through the private sector in urban India.
- Unregulated private enterprise can create significant negative effects. For instance, a large proportion of deaths in India manifests due to the poor quality of healthcare than due to insufficient access; this proportion is significantly higher than neighbouring countries and other countries in the world.
- The quality of treatment in the private sector does not seem to be markedly better in the private sector when compared to the public sector.
- Yet, the costs of treatment are not only uniformly higher in the private sector, but the differences are also humongous for in-patient treatments of severe illnesses such as cancers (3.7x), cardio (6.8x), injuries (5.9x), gastro (6.2x), and respiratory (5.2x).
- Given the information asymmetries that make unregulated private enterprise suboptimal in healthcare, a sectoral regulator that undertakes regulation and supervision of the healthcare sector must be seriously considered.
Telemedicine
- Telemedicine refers to the practice of caring for patients remotely when the provider and patient are not physically present with each other.
- Impressive growth has been seen in the adoption of telemedicine in India since the outbreak of the COVID-19 pandemic. The Ministry of Health and Family Welfare (MoHFW) issued Telemedicine Practice Guidelines 2020 in March 2020.
- eSanjeevani OPD (a patient-to-doctor tele-consultation system) has recorded almost a million consultations since its launch in April 2020.
- The number of telemedicine consultations correlates strongly with Internet penetration in a state.
- Thus, the success of telemedicine critically hinges on having a decent level of health infrastructure and Internet connectivity nationwide.
- Specifically, investing in Internet access can lead to greater uptake of telemedicine, which in turn can greatly help reduce geographic disparities in healthcare access and utilization.
Way Forward
- The next health crisis may not possibly involve a communicable disease. Therefore, India’s healthcare policy must continue focusing on its long-term healthcare priorities but not limiting it to communicable diseases. Simultaneously, to enable India to respond to pandemics, the health infrastructure must be agile.
- For instance, every hospital may be equipped so that at least one ward in the hospital can be quickly modified to respond to a national health emergency while caring for the normal diseases in usual times.
- Governments need to invest in telemedicine on a mission mode to complement the government’s digital health mission and thereby enable greater access to the masses.
- An increase in public spending from 1% to 2.5-3% of GDP – envisaged in the National Health Policy 2017 – can decrease the OOPE from 65% to 30% of overall healthcare spend.
- PM - Jan Aarogya Yojana has been a marquee evolution in this direction, providing financial affordability to a large percentage of the Indian population and must be continued.
- A standardised system for quality reporting on healthcare for hospitals, physicians and insurance companies can start with basic input indicators to be reported mandatorily by every healthcare stakeholder.
Chapter 6
Process Reforms: Enabling Decision-Making under Uncertainty
International comparisons show that the problems of India’s administrative processes (in firms insolvency) derive less from lack of compliance to processes or regulatory standards, but from overregulation. Even when there is no dispute/litigation and all paperwork is complete, it takes 1570 days (4.3 years) for a firm or a company to be struck off from the records. This is an order of magnitude longer than what it takes in other countries.
Key Points
- The problem of over-regulation and opacity in Indian administrative processes flows from the emphasis on having complete regulations that account for every possible outcome.
- The real issue seems to be the effectiveness of regulations caused by undue delays, rent seeking, complex regulations and quality of regulation.
- The ‘World Rule of Law Index’ published by the World Justice Project provides a cross country comparison on various aspects of regulatory enforcement.
- In 2020, India’s rank was 45th out of 128 countries in the category of ‘Due process is respected in administrative proceedings’ (proxy for following due process).
- In contrast, in the category ‘Government regulations are effectively enforced’ (proxy for regulatory quality/effectiveness), the country’s rank is 104.
- This shows that, contrary to the popular belief, India is relatively good at complying with processes, but lag in regulatory effectiveness.
- India is placed better than other BRICS countries (barring South Africa) in terms of respecting due process, but worse than them in the effectiveness of those standards.
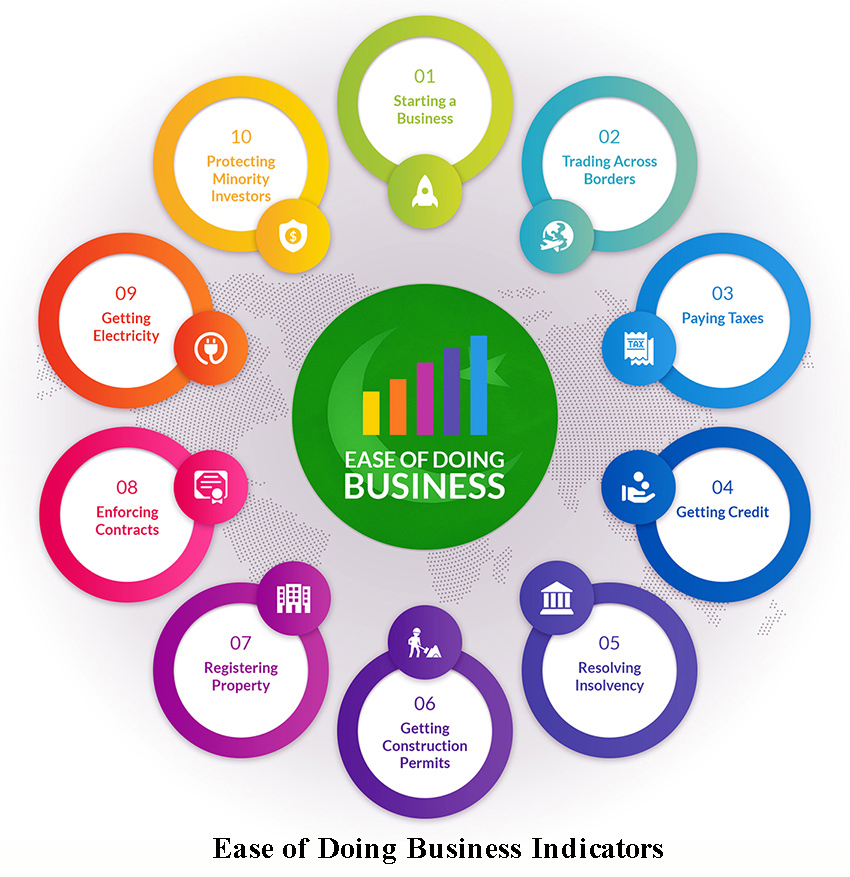
- Similarly, the World Bank’s Ease of Doing Business (EoDB) report (2020) shows that despite making huge strides in the overall EoDB rank, India still lags behind in the sub-categories ‘Starting a business’ and ‘Registering Property’ where the country’s rank is 136 and 154 respectively.
Problem of Regulatory Default
- There is a need to create simple regulation and complement the same by providing flexibility and discretion to the supervisor.
- However, if the legal and institutional frameworks do not explicitly limit mushrooming of regulations, policymakers may naturally drift towards more regulation, even if it is suboptimal for the economy.
- While analyzing the principal-agent problem, it is argued that multi-dimensional tasks are ubiquitous in the world and agents have to divide their time among various duties. In such cases, agents choose the tasks whose outcomes are measurable.
- For example, if there is an incentive to pay for teachers based on their students’ test scores, then teachers will focus on the narrowly defined basic skills that are tested on standardised tests and not on the various aspects of student learning.
- In effect, they will focus on what can be effectively measured.
NOTE
- The principal-agent problem is a conflict in priorities between a person or group and the representative authorized to act on their behalf. An agent may act in a way that is contrary to the best interests of the principal. The principal-agent problem is as varied as the possible roles of principal and agent.
- Similarly, as regulation can be easily measured while supervision cannot be measured easily, regulators and decision-makers would prefer to substitute supervision with more and more regulation.
- After all, regulations provide criteria or checklists, making it easier for regulators to follow and reduce their accountability later on.
- On the other hand, it is difficult to quantify the amount and quality of supervision. Naturally, policymakers by default tend to favour prescriptive regulation.
- This creates a perverse incentive to keep adding more top-down regulations regardless of their effectiveness.
- Since regulations are defined, they are easy to measure ex-ante. Bureaucracies will naturally tend to substitute supervision with mechanical regulations and will not exercise discretion even when it is available.
Solving for Discretion
- It should be clear that there is no substitute for active supervision and discretion.
- Specifically, ex-ante (before event) regulation cannot substitute for ex-post (after the event) supervision; in fact, more ex-ante regulation only serves to dilute the quality of ex-post supervision by fostering opaque discretion.
- Strengthen ex-ante accountability:
- The property rights literature based on incomplete contracts argues for the strengthening of governance in institutions by vesting more power in boards and then holding them accountable ex-ante.
- Instead of relying too much on ex-post audits, which anyway suffer from hindsight bias, ex-ante accountability needs to be entrusted with the boards of institutions.
NOTE
- Hindsight bias is a psychological phenomenon that allows people to convince themselves after an event that they had accurately predicted it before it happened. This can lead people to conclude that they can accurately predict other events. Hindsight bias is studied in behavioral economics because it is a common failing of individual investors.
- Bring transparency:
- The second way towards effective supervision is to incorporate transparency into the decision-making process.
- Transparency, apart from having intrinsic value, is appreciated because it promotes trust in public institutions and makes markets efficient.
- The discretion in the system needs to be balanced with the transparency in decision making.
- For example, Government e-Marketplace (GeM) has resulted in a substantial reduction in prices in comparison to the tender, rate contract and direct purchase rates that were used previously.
- Build resilient ex-post resolution mechanism:
- Despite having all regulations in place and best efforts to deal with effective supervision ex-ante, devising a robust ex-post resolution mechanism is imperative.
- There is a need for efficient legal systems (i.e. courts and institutions) such as Insolvency and Bankruptcy Code (IBC), Debt Recovery Tribunals, etc.
- Along with them, the Courts and the legal structure in India need to be strengthened to fasten the litigation process and a quicker resolution of the liquidation processes can be achieved.
Direction of Administrative Process Reforms
- Since Independence, a plethora of autonomous bodies had proliferated. There is a need to prune them consistently not just from a cost perspective but in order to maintain transparency, accountability and efficient supervision.
- There is a need for enacting a Transparency of Rules Act to end any asymmetry of information regarding rules and regulations faced by a citizen.
- The reform solves the problem that rules frequently change and often the citizen has to follow a long paper trail of circulars and notifications to know the current requirements.
- Further, all laws, rules and regulations need to be presented as an updated, unified whole at all times. This will bring transparency and simplify the understanding of regulations.
Conclusion
Both economic theory and evidence show that in an uncertain and complex world, it is not possible to write regulations that account for all possible outcomes. This makes discretion unavoidable in decision-making. The attempt to reduce discretion by having ever more complex regulations, however, results in even more non-transparent discretion. The solution is to simplify regulations and invest in greater supervision which, by definition, implies a willingness to allow some discretion.
Chapter 7
Regulatory Forbearance: An Emergency Medicine, Not Staple Diet!
Regulatory forbearance for banks involves relaxing the norms for restructuring assets, where restructured assets were no longer required to be classified as Non-Performing Assets (NPAs) and therefore did not require the levels of provisioning that NPAs attract. The current regulatory forbearance on bank loans has been necessitated by the COVID-19 pandemic.
Key Points
- To address the economic challenges posed by the COVID-19 pandemic, financial regulators across the world have adopted regulatory forbearance. India is no exception.
- In 2008, anticipating the global financial crisis, RBI introduced the policy of regulatory forbearance.
- It relaxed the norms for restructuring stressed assets - downgrading the asset to non-performing status was no longer mandatory and required no additional provisioning.
- Emergency measures such as forbearance prevent spillover of the failures in the financial sector to the real sector, thereby avoiding a deepening of the crisis.
- However, caution must be exercised so that emergency medicine does not become a staple diet because borrowers and banks can easily get addicted to such palliatives.
- When emergency medicine becomes a staple diet, the negative side effects may not only be large but may also last for a while.
|
Economic Rationale for Forbearance |
|
|
Without forbearance |
With forbearance |
|
If the project is viable, the bank would restructure the asset and downgrade it to a Non-Performing Asset (NPA) and provision for the same. |
If the project is viable, the bank would restructure the asset. As restructured assets do not require the same level of provisioning as NPAs, inadequate provisions are made. |
|
If the project is unviable, the bank would not restructure the loan and declare the asset as non-performing. Crucially, banks do not gain by restructuring unviable projects in this case. |
Capital-starved banks now have an incentive to restructure even unviable projects to reduce provisioning and avoid the consequent hit on capital. |
|
|
Original Sin: The Seven Year Forbearance
- The tendency to restructure any given borrower, including unviable ones is, however, significantly higher in the years after the Global Financial Crisis (2008).
- Evidently, once the banks got a signal about the continuation of forbearance despite the economic recovery, several types of distortions crept in.
- The P. J. Nayak Committee (2014), constituted by RBI, highlighted in its report submitted in May 2014 the twin concerns stemming from the forbearance regime: ever-greening of loans by classifying NPAs as restructured assets and the resultant undercapitalization of banks.
- For instance, it stated, “the existing tier-I capital for public sector banks is overstated because of the regulatory forbearance which RBI provides on restructured assets.
- Without forbearance these assets would be categorized as NPAs, the restructuring being a response to likely imminent default.
- Thus, in essence, many banks were undercapitalized during the forbearance period.
- Once the forbearance policy was discontinued in 2015, RBI conducted an Asset Quality Review to know the exact amount of bad loans present in the banking system.
- As a result, banks’ disclosed NPAs increased significantly from 2014-15 to 2015-16.
- In the absence of forbearance, banks preferred disclosing NPAs to the restructuring of loans.
- Thus, the roots of the present banking crisis go back to the prolonged forbearance policies followed between 2008 and 2015.
Impacts of Forbearance on Banks
- Banks are in the business of converting illiquid loans into liquid liabilities i.e. while banks issue deposits repayable on demand or after a specific period, they lend to projects with long gestation periods. Therefore, they face risks both from:
- the mismatch in timing of their inflows and unexpected outflows (referred to as liquidity mismatch) and
- also due to an unexpected surge in borrower default.
- A policy of prolonged forbearance has the effect of overstating the actual capital and creating a false sense of security.
- Forbearance lets undercapitalized banks operate without raising capital.
- If forbearance is continued for an extended period, the bank may consider the capital above the regulatory minimum as “excess” and start repaying capital to the incumbent owners as dividends. Thus, the usual pecking order of finance where debt is repaid before equity gets reversed.
- The forbearance period witnessed an increase in lending to unproductive firms, popularly referred to as “zombies”.
- Zombies are typically identified using the interest coverage ratio, the ratio of a firm’s profit after tax to its total interest expense.
- Firms with an interest coverage ratio lower than one are unable to meet their interest obligations from their income and are categorized as zombies.
- Forbearance regime witnessed a significant increase in credit supply to corporates with poor operating metrics and a simultaneous decrease in their investment-to-debt ratio suggesting that the increased credit supply was not used productively by firms and was instead diverted for the private benefit of the incumbent management.
- Aided by poor governance, beneficiary firms under the forbearance regime also seem to have misallocated capital in unviable projects.
- The forbearance regime also accompanied an increase in defaults by restructured firms when compared to a decrease in the same in the pre-forbearance era.
Implications for the Current Forbearance Regime
- Forbearance represents emergency medicine that should be discontinued at the first opportunity when the economy exhibits recovery, not a staple diet that gets continued for years.
- Therefore, policymakers should lay out thresholds of economic recovery at which such measures will be withdrawn and thresholds should be communicated to the banks in advance so that they can prepare for the same as prolonged forbearance is likely to sow the seeds of a much deeper crisis.
- A clean-up of bank balance sheets is necessary when the forbearance is discontinued. A clean-up exercise should be accompanied by mandatory recapitalization based on a thorough evaluation of the capital requirements post an asset quality review.
- The asset quality review must account for all the creative ways in which banks can evergreen their loans.
- In this context, it must be emphasized that advance warning signals that do not serve their purpose of flagging concerns may create a false sense of security.
- The banking regulator needs to be more equipped in the early detection of fault lines and must expand the toolkit of ex-ante remedial measures.
- Apart from re-capitalizing banks, it is important to enhance the quality of their governance.
- To avoid evergreening and zombie lending following the current round of forbearance banks should have fully empowered capable boards.
- Sound governance is a key metric to ensure that banks do not engage in distortionary lending post capital infusion.
- The judicial infrastructure for the implementation of IBC – composed of Debt recovery tribunals, National Company Law Tribunals, and the appellate tribunals must be strengthened substantially.
Conclusion
The prolonged forbearance policies following the GFC thus engendered the recent banking crisis that brought down investment rates and thereby economic growth in the country. The lesson for policymakers is to treat emergency measures as such and not to extend them even after recovery: when an emergency medicine becomes a staple diet, it can be counterproductive.
Chapter 8
Innovation: Trending Up But Needs Thrust, Especially From The Private Sector
India entered the top 50 innovating countries for the first time in 2020 since the inception of the Global Innovation Index (GII) in 2007, by improving its rank from 81st in 2015 to 48th in 2020. This assumes greater importance in the context of enhancing private participation in innovation in India - in terms of contribution to gross expenditure on Research & Development (R&D), R&D personnel and researchers, and share in patents filed in the country.
Why Innovation Matters?
- The importance of technological progress in economic growth began with the Solow model, which highlighted that output per worker mainly depends on savings, population growth and technological progress.
- Research showed that small enterprise R&D activities brought large returns to the national economy through new technologies.
- There is an established relationship between entrepreneurship innovation and economic growth suggesting an increase of 10% in R&D investment has been associated with productivity gains ranging from 1.1% to 1.4%.
- There is a positive correlation between past innovation performance (three-years ago in 2016 and five years ago in 2014) with GDP per capita in PPP (Purchasing Power Parity) terms (2019) across countries.
Global Innovation Index
- The GII (since 2007) is published by Cornell University, INSEAD, and the World Intellectual Property Organization (WIPO), a specialized agency of the United Nations. It seeks to assist economies in evaluating their innovation performance.
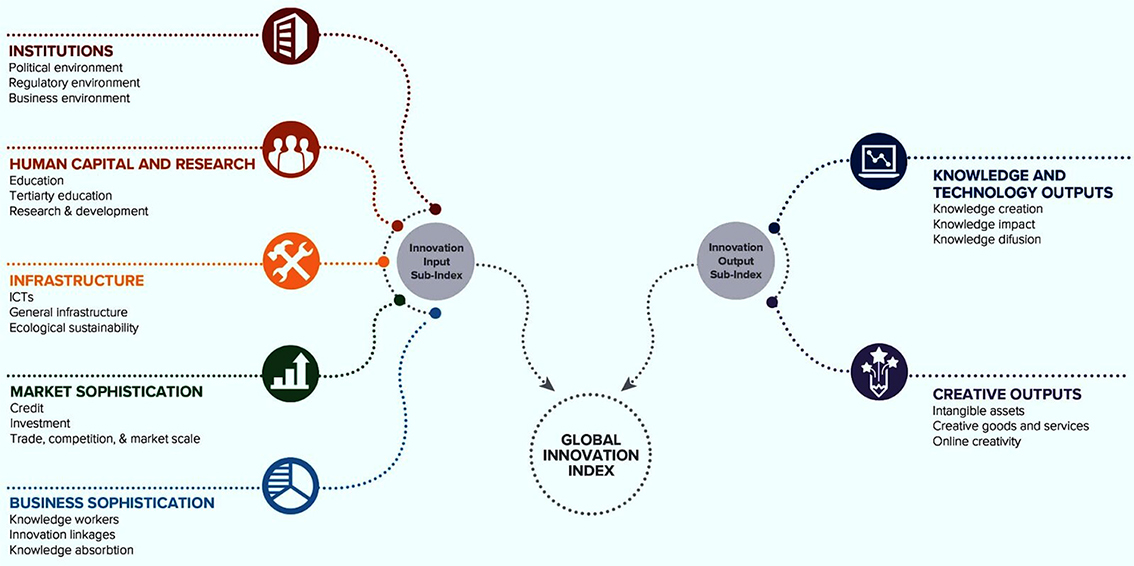
- GII has two sub-indices: the Innovation Input Sub-Index and the Innovation Output Sub-Index, and seven pillars, each consisting of three sub-pillars, further divided into a total of 80 indicators.
- The Innovation Input sub-index and the Innovation Output Sub-Index have equal weight in calculating the overall GII.
- The Innovation Input sub-index has five pillars: (i) Institutions; (ii) Human Capital and Research; (iii) Infrastructure; (iv) Market Sophistication; and (v) Business Sophistication. The Innovation Output Sub-Index has two pillars (i) Knowledge and Technological outputs and (ii) Creative outputs.
- GII 2020 includes 131 countries/economies, which represent 93.5 % of the world’s population and 97.4% of the world’s GDP in purchasing power parity current international dollars.
India and Innovation
- India ranks 48th amongst 131 countries in terms of its innovation performance as measured using the Global Innovation Index (GII) 2020.
- India entered the top 50 innovating countries for the first time since the inception of the index in 2007. Along with three other economies – Vietnam, Republic of Moldova and Kenya, India has the rare distinction of being an innovation achiever for ten consecutive years.
- India performed particularly well regionally and in its income category, ranking first in the GII rankings in Central and South Asia, and third amongst lower middle-income group economies.
- India performs above expectation for its level of development (per capita GDP) on the GII as well as the Innovation Output and Innovation Input sub-indices.
- R&D investment is a key input in innovation.
- Although India’s gross domestic expenditure on R&D (GERD) is in line with expectation for its level of development, there is much scope for improvement.
- In India, the Government contributes 56% of GERD while this proportion is less than 20% in each of the top ten economies.
- The total number of patents filed in India has risen steeply since 1999, mainly on account of an increase in patent applications filed by non-residents.
- While patent applications filed by residents have increased steadily since 1999, they have risen at a much lower rate than patent applications by non-residents.
- Given that most of these large economies are more innovative than India and equity market development facilitates greater high-technology innovation, this potentially indicates that innovation in India needs to become more high-tech intensive.
Prospects for India
- India is a highly attractive R&D destination on account of the opportunities offered for outsourcing, highly skilled labour force, low cost labour and R&D activities.
- This has led to large scale off-shoring from US firms, especially in the IT industry and that companies such as IBM, Intel, and GE conduct cutting-edge R&D in India.
- The economic growth and increasing income levels in India have made the Indian market attractive, and local R&D activities have been on the rise, particularly in the automotive market.
- Thus, India has world-class potential both as a global R&D centre targeting global markets and as a regional R&D hub for its local market and markets in emerging countries.
- It may be seen that India is able to effectively translate investments in innovation inputs to produce a higher level of innovation outputs.
- This implies that India stands to gain more from its investments into innovation than many other countries.
- With higher investments, it may be possible that this relationship between innovation inputs and innovation outputs becomes even more favourable for India, and there is greater “bang for the buck” as regards India’s investments in innovation.
Policy Implications
- India needs greater thrust on innovation to catapult itself to a higher growth trajectory and become the third-largest economy in GDP current US$ in the near future.
- This requires boosting gross expenditure on R&D from 0.7% of GDP currently, to at least the average level of GERD in other top ten economies (GDP current US$) of over 2%.
- India’s performance on innovation has been lower than expected for its level of access to equity finance.
- India’s business sector needs to rise to the occasion and significantly ramp up its gross expenditure on R&D to a level commensurate to India’s status as the fifth-largest economy in GDP current US$.
- Given the low level of contribution to GERD by the business sector despite the generous incentive regime prevailing earlier, businesses in India must focus on innovation to remain competitive in the new economy.
- This assumes greater importance in the context of enhancing private participation in innovation in India - in terms of contribution to gross expenditure on R&D, R&D personnel and researchers, and share in patents filed in the country.
Conclusion
India should focus on improving its performance on institutions and business sophistication since higher performance on these dimensions seem to consistently suggest higher innovation outputs performance. India could focus on within the institutions and business sophistication input pillars to further augment its performance in innovation outputs.
Chapter 9
JAY Ho: Ayushman Bharat's Jan Arogya Yojana (JAY) and Health Outcomes
In 2018, Government of India approved the Ayushman Bharat Pradhan Mantri Jan Arogya Yojana (AB-PM-JAY) as a historic step to provide healthcare access to the most vulnerable sections in the country. Beneficiaries included approximately 50 crore individuals across 10.74 crores poor and vulnerable families, which form the bottom 40% of the Indian population.
Key Points
- The scheme provides for the healthcare of up to ₹5 lakh per family per year on a family floater basis, which means that it can be used by one or all members of the family.
- PMJAY is being used significantly for high frequency and low-cost care consistent with the general utilisation of healthcare services.
- The scheme provides for secondary and tertiary hospitalization through a network of public and empanelled private healthcare providers. It also provides for three days of pre-hospitalization and 15 days of post-hospitalization expenses, places no cap on age and gender, or size of a family and is portable across the country.
- PM-JAY also aims to set up 150,000 health and wellness centres to provide comprehensive primary health care service to the entire population.
- As per the latest annual report of PM-JAY released by the National Health Authority (NHA), 2019), the status of implementation is as follows:
- 32 states and UTs implement the scheme,
- 13.48 crore E-cards have been issued,
- Treatments worth ₹7,490 crores have been provided (1.55 crores hospital admission),
- 24,215 hospitals empanelled.
Public Goods, Democracies and Governance
- Certain goods can be conceptualised as “public goods” and argued that that “no decentralized pricing system can serve to optimally determine these levels of collective consumption (of the public good).”
- As public goods are non-rival and non-excludable, market failures predominate in the provision of such goods.
- Also, given their non-rivalry, private producers cannot make the requisite profits to justify investing in such goods. Therefore, public goods may get severely under-produced without intervention by a government.
- Since public goods are not adequately provided for by the markets, they must be supplied by the government. Therefore, provisioning for public goods and ensuring their supply represents one of the most important functions of a government.
- Governance, therefore, entails effective delivery of public goods and services to the vulnerable sections of society.
- Despite the importance of the delivery of public goods, governments may suffer from the “horizon problem” in democracies, where the time horizon over which the benefits of public goods reach the electorate may be longer than the electoral cycles.
- Myopia that this creates may, therefore, lead to under-provisioning of public goods by governments.
- Research in political economy, for instance, shows that democratic rulers are often short-sighted due to the constant political challenge presented through electoral cycles. As a result, many democratically elected governments can focus only on short-term gains rather than commit to long-term projects.
- Therefore, the provision of public goods that generate long term gains to the economy and society represents a key aspect of governance in a democratic polity.
Health Outcomes of PM-JAY
- PM-JAY has helped the Indian states in achieving reduced infant and child mortality rates.
- On analysis based on NFHS-4 and NFHS-5, neonatal mortality rate (NNMR) declined by 22% in the states that adopted PM-JAY in comparison to a 16% decline in states that did not adopt PM-JAY.
- The reduction in Infant mortality rate (IMR) was 20 per cent vis-à-vis 12 per cent in PM-JAY and non-PM-JAY states respectively,
- While the proportion of people ensuring family planning rose across all the states between the two surveys, the increase is much more significant in the states that adopted PM-JAY indicating its effectiveness.
- The percentage of mothers who received post-natal care within two days of delivery increased by 15% in the PM-JAY states vis-à-vis an increase of only 9% in the non-PM-JAY states.
- Health outcomes pertaining to the vaccination of the child and vitamin-A supplementation improved remarkably in the states which adopted the PM-JAY.
- PM-JAY has not only been successful in improving health outcomes across states but has also accounted for the increase in the spread of knowledge and awareness regarding important health concerns like HIV/AIDS.
Conclusion
Even though only a short time has elapsed since its introduction, the effects that are identified by the Survey underscores the potential of the program to significantly alter the health landscape in the country, especially for the vulnerable sections.
Chapter 10
The Bare Necessities
Access to “the bare necessities” such as housing, water, sanitation, electricity and the clean cooking fuel is a sine qua non to live a decent life. The Bare Necessities Index is developed to analyse this sine qua non by summarising 26 indicators on five dimensions viz., water, sanitation, housing, micro-environment, and other facilities.
Key Points
- Since the 1950s, when Shri. Pitambar Pant advocated the idea of “minimum needs”, the idea that economic development can be viewed as a process of providing the “bare necessities of life” to citizens has been around in India.
- A family’s ability to access bare necessities – such as housing, water, sanitation, electricity and clean cooking fuel – have therefore been regarded as an important barometer of economic development in academic and policymaking circles.
- Access to clean drinking water, safe sanitation and clean cooking fuel also have direct linkages with the health of the members in the household.
- To measure the progress in the delivery of “the bare necessities”, the Survey has developed a composite index called the Bare Necessities Index (BNI).
- The BNI measures access to “the bare necessities” for households in rural areas, urban areas and at the all India level.
- These necessities are measured using 26 comparable indicators on five dimensions viz., water, sanitation, housing, micro-environment, and other facilities.
- The indicators used to capture the availability and quality of housing, access to bathroom, kitchen, toilet, drinking water, waste discharge facilities, clean cooking fuel and disease-free environment, etc.
- The composite index for the States/UTs for 2012 and 2018 has been created using data mainly from two NSO rounds viz., 69th (2012) and 76th (2018), on Drinking Water, Sanitation, Hygiene, and Housing Condition in India.
Overall BNI
- It is quite evident that in most of the states, the access to bare necessities for the households in 2018 is significantly better compared to 2012.
- Access to bare necessities in 2018 is the highest in the States such as Kerala, Punjab, Haryana, Gujarat, Uttrakhand, Delhi, Goa, Mizoram and Sikkim while it is the lowest in Odisha, Jharkhand, West Bengal and Tripura.
- In rural India, the highest access to bare necessities in 2018 is recorded in Punjab, Kerala, Sikkim, Goa and Delhi, while the lowest in Uttar Pradesh, Madhya Pradesh, Bihar, Jharkhand, West Bengal, Odisha, Assam, Manipur and Tripura.
- In urban India, no State is showing the lowest level of BNI in 2018, and the States showing improvement over 2012 include Uttarakhand, Jammu and Kashmir, Punjab, Rajasthan, Madhya Pradesh, Maharashtra, Karnataka, etc.
- The improvement is significantly higher in the rural areas when compared to the urban areas.
Drinking Water Accessibility Index
- The sub-index for access to drinking water, drinking water accessibility index, is composed of sub-dimensions viz., the principal source of drinking water, distance from source of water, nature of access, and method of taking out water.
- Access to drinking water to households in most of the States has improved in 2018 compared to 2012, in rural as well as in urban areas, (except for Andhra Pradesh in Rural and Andhra Pradesh and Himachal Pradesh in urban areas).
- States such as Sikkim, Punjab, Haryana are at the top while Odisha, Jharkhand and Andhra Pradesh are at the bottom.
- Regional disparities have increased in 2018 when compared to 2012 despite such disparities declining in urban areas.
Sanitation Index
- Indicators used in the sub-index are the percentage of households by access to latrine for exclusive use, the type of latrine viz., piped sewer system, septic tank, twin leach pit, single pit.
- Sanitation access has improved for all States in rural areas and for most of the States in urban areas in 2018 compared to 2012.
- Regional disparities in access to sanitation have declined as the states having low access to sanitation in 2012 have gained more.
Housing Index
- The housing index measures not only the structure of the house (in terms of Pucca or Katcha) but also the quality of the house in terms of the type of dwelling unit (independent or not) and condition of the structure.
- The access to housing has improved in all States, except urban areas in few States.
- The inter-State disparities have also declined as the States having low levels in 2012 have gained more.
- The improvement in access to housing has also been disproportionately greater for the lowest income group when compared to the highest income group, thereby enhancing equity in access to housing in 2018 vis-à-vis 2012.
Micro-environment Index
- The micro-environment index measures the percentage of households who are living in a dwelling unit with access to drainage (indicated in terms of access to drainage and quality of drainage in terms of other than Katcha drainage), without problems of flies/mosquitoes (indicated by other than severe), and efforts made by local bodies/State government to tackle the problem of flies/mosquitoes.
- Micro-environment, as measured by the index, has improved in 2018 for all States, except for Assam in rural and Odisha and Assam in urban areas.
- Regional disparities have declined sharply in urban areas in 2018 vis-à-vis 2012, though it was increased in the rural areas.
- The micro-environment is much better in urban areas when compared to the rural areas, and the rural-urban gaps are large.
Health Outcomes
- The efforts being put through public as well as the private mode has been instrumental in increasing the benefits arising out for humanity at large.
- Access to improved sanitation also reduces the risk of contracting diarrhoea and further, the access to the piped water and sanitation is critical in reducing the child mortality substantially.
- Access to clean cooking fuel improves child health as studies have found a significant trend for higher infant mortality among households that cooked with a greater proportion of biomass fuel.
- Having a separate kitchen improves the indoor environment, thereby yielding health benefits to the household, especially women and children. Access to housing, better housing conditions and amenities are closely connected with health outcomes.
Education Outcomes
- Water hauling, a daily activity, consumes substantial time and effort of a household is found to be negatively associated with the girls’ school attendance.
- Access to latrine in schools substantially increases enrolment of pubescent-age girls.
- Further, the electrification’s links with education, which could be through lighting and use of other equipment, are visible in day-to-day life.
- In fact, there is a strong correlation between electricity consumption per capita and higher scores on the education index across countries.
- The State-wise BNI in 2012 and 2018 correlates positively with the gross enrolment ratio for class 9-10 and class 11-12.
Conclusion
Government schemes, such as the Jal Jeevan Mission, Swachh Bharat Mission, Pradhan Mantri Awas Yojana, etc. have been appropriate strategies to address these gaps to enable India to achieve the SDG goals of reducing poverty, improving access to drinking water, sanitation and housing by 2030. There should be effective targeting of the needier population. There must be effective convergence in scheme implementation at the Centre-State and local levels.


