Indian Economy
Sharp Economic Recovery
- 02 Sep 2021
- 5 min read
Why in News
Recently, the National Statistical Office data has revealed that the Indian economy grew at a record pace of 20.1% in April-June 2021, as compared to the corresponding period last year.
- Last year, Gross domestic product (GDP) contracted 24.4% in the same period, when the national lockdown due to the Covid-19 pandemic had nearly halted all economic activities.
Key Points
- About Economic Recovery:
- The first quarter’s high growth rate, has come despite a brutal second wave of the pandemic which peaked in April-May 2021.
- The sharp increases were largely due to the low base (-24.4%) of the first quarter of 2020-21.
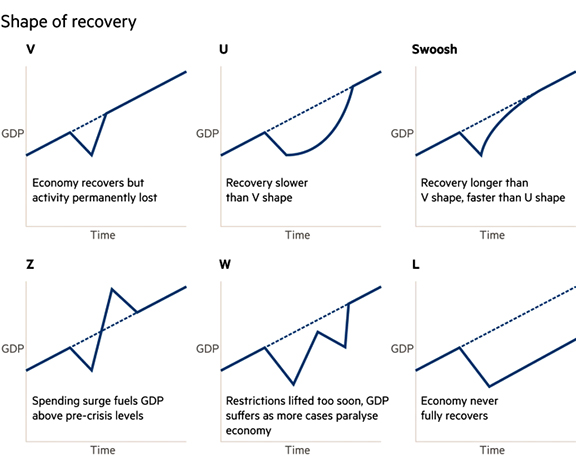
- This growth reaffirms the government’s prediction of an imminent V-shaped recovery made last year.
- However, despite phenomenal economic recovery, the GDP in the first quarter is still 9.2% lower than the GDP in the same period during the pre-Covid year 2019-20.
- Amongst sectors, manufacturing and construction imparted a significant push to the economy in April-June, growing 49.63% and 68.3% respectively, over April-June 2020.
- However, the services sector continued to lag.
- Sectors including ‘agriculture, forestry and fishing’ and ‘electricity, gas, water supply and other utility services’ are above the levels of the pre-Covid year of 2019-20.
- V-shaped Economic Recovery:
- A V-shaped recovery is characterized by a quick and sustained recovery in measures of economic performance after a sharp economic decline.
- Such recoveries are generally spurred by a significant shift in economic activity caused by rapid readjustment of consumer demand and business investment spending.
- About NSO:
- It is the central statistical agency of the Government mandated under the Statistical Services Act 1980 under the Ministry of Statistics and Programme Implementation.
- It is responsible for the development of arrangements for providing statistical information services to meet the needs of the Government and other users for information on which to base policy, planning, monitoring and management decisions.
- Reports & Indices by NSO:
Measuring Total Output of Economy
- Total Output in an economy can be measured by two ways:
- Measuring total demand: Gross Domestic Product (GDP)
- Measuring total supply: Gross Value Added (GVA)
- About GDP:
- It is the total monetary value of final goods and services, those that are bought by the final user and produced in a country in a given period of time.
- The GDP data show what is happening to the four engines of economic growth in any economy. These four engines are:
- Private Final Consumption Expenditure (C)
- Investment (I)
- Government Final Consumption Expenditure (G)
- Net Exports” (NX) (Exports-Imports)
- GDP = C + I + G + NX
- About GVA:
- It looks at how much value was added (in money terms) in different productive sectors (such as Agriculture, Electricity, etc.) of the economy.
- It tells which specific sectors are doing well and which are struggling to add value.
- Difference Between GDP And GVA:
- On the face of it, the total output should be the same in the case of measuring Total Demand or Total Supply.
- However, every economy has a government, which imposes taxes and also provides subsidies.
- As such, GDP is “derived” by taking the GVA data and adding the taxes on different products and then subtracting all the subsidies on products.
- In other words, GDP = (GVA) + (Taxes earned by the government) — (Subsidies provided by the government).
- The difference between these two absolute values will provide a sense of the role the government played.
- If the government earned more from taxes than what it spent on subsidies, GDP will be higher than GVA.
- If, on the other hand, the government provided subsidies in excess of its tax revenues, the absolute level of GVA would be higher than the absolute level of GDP.


