Facts for UPSC Mains
Rangarajan Poverty Line
- 22 Oct 2025
- 8 min read
Why in News?
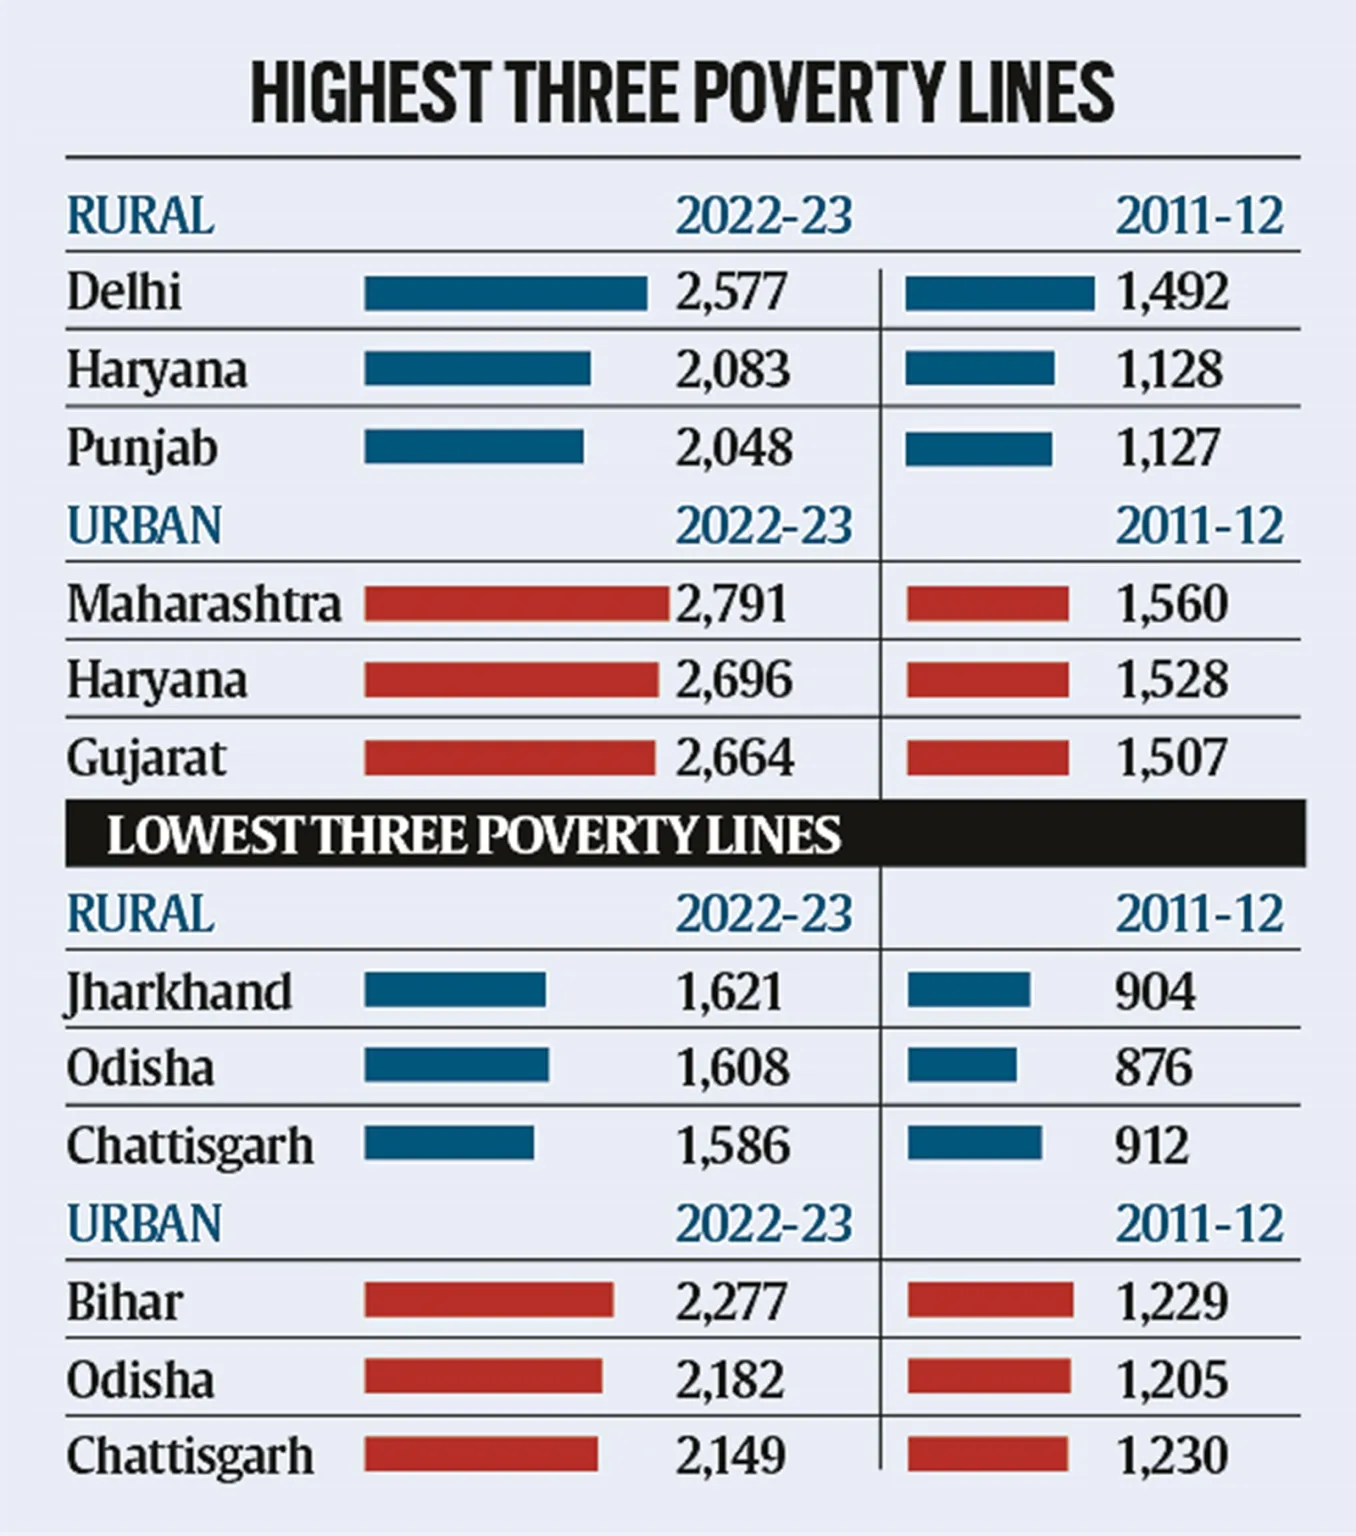
Economists from the Reserve Bank of India’s (RBI) Department of Economic and Policy Research published a paper in which they ‘updated’ the Rangarajan Poverty Line for 20 major states of India, using data from the Household Consumption Expenditure Survey (HCES) 2022-23.
What are the Key Highlights of RBI’s Paper on Updated Rangarajan Poverty Line?
- Biggest Improvements: Odisha and Bihar showed the largest decline in poverty levels since 2011-12, with rural poverty in Odisha falling from 47.8% to 8.6% and urban poverty in Bihar falling from 50.8% to 9.1%.
- Smallest Declines: Kerala and Himachal Pradesh showed the least decline in poverty percentages because their poverty levels were already low.
- Rural and Urban Extremes: In 2022-23, rural poverty was lowest in Himachal Pradesh (0.4%) and highest in Chhattisgarh (25.1%). Urban poverty was lowest in Tamil Nadu (1.9%) and highest in Chhattisgarh (13.3%).
- Consumption Pattern Changes: The study acknowledges that consumption patterns changed between 2011-12 and 2022-23, suggesting that poverty baskets and lines may need further updates in the future.
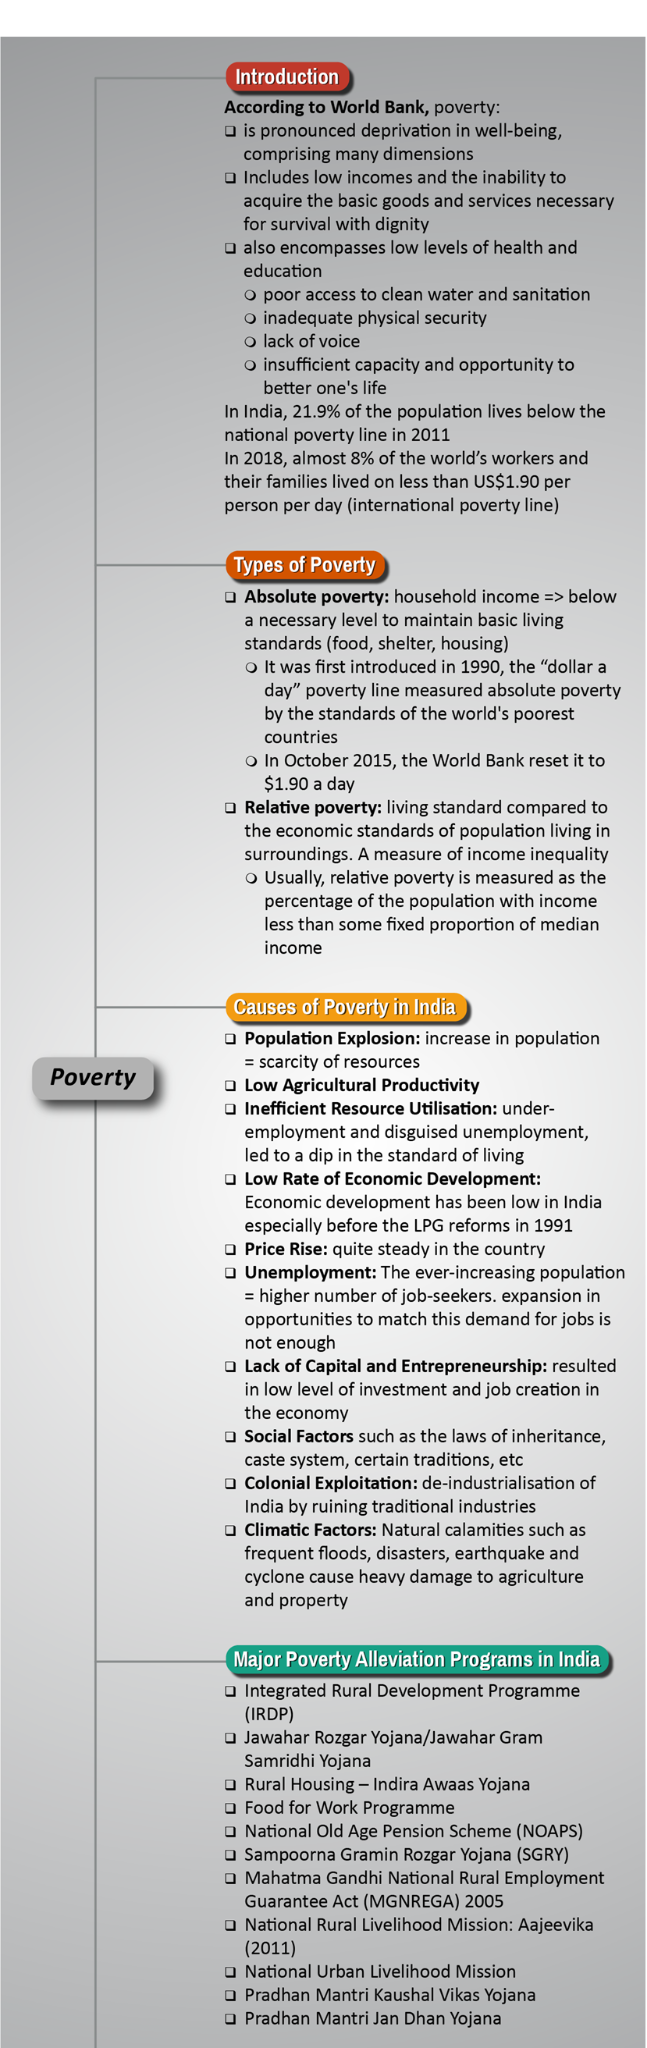
What is Poverty?
- Poverty: According to the World Bank, poverty is “pronounced deprivation in well-being.” The poor are those who do not have sufficient income or consumption to rise above an adequate minimum threshold.
- According to NITI Aayog, poverty is measured by setting a poverty line (the minimum expenditure needed to meet basic socially acceptable needs) and the poverty ratio denotes the share of the population living below this line.
- The World Bank raised the International Poverty Line from USD 2.15/day (2017 Purchasing power parity (PPP)) to USD 3.00/day (2021 PPP).
- Importance of Measuring Poverty: Measuring poverty is essential to compare deprivation across households, regions, and countries; track changes over time; monitor trends; and design, implement, and evaluate effective poverty-reduction strategies.
- Poverty Estimation in India:
- Pre-Independence: Efforts to estimate poverty began with Dadabhai Naoroji’s book “Poverty and Un-British Rule in India”, followed by the National Planning Committee (1938) and the Bombay Plan (1944), which discussed minimum living standards and income levels.
- Post-Independence: The Planning Commission (1962) initiated an official poverty assessment.
- Later committees like Alagh Committee (1979) and Lakdawala Committee (1993) refined the methodology, focusing on consumption expenditure and calorie norms.
- Tendulkar Committee (2009): Shifted from calorie-based norms, recommended a uniform all-India Poverty Line Basket (PLB), and adopted Mixed Reference Period (MRP) consumption data.
- It estimated the 2011–12 poverty line at Rs 816 (rural) and Rs 1,000 (urban) per capita per month.
- Rangarajan Committee (2014): Formed after criticism of the Tendulkar method, it reverted to separate rural and urban PLBs, estimating Rs 972 (rural) and Rs 1,407 (urban) per capita per month.
- However, the government did not adopt its recommendations officially.
- Multidimensional Poverty Index (MPI): Launched in 2010 by United Nations Development Programme and Oxford Poverty & Human Development Initiative (OPHI), the MPI measures poverty beyond income, considering deprivations in health, education, and living standards.
- It reflects both the proportion of poor people and the average number of deprivations they experience simultaneously.
- In 2025, the Global Multidimensional Poverty Index (MPI) shows that 1.1 billion people (18.3%) across 109 countries live in acute multidimensional poverty, with 43.6% facing severe deprivation in at least half of the indicators.
- National Multidimensional Poverty Index (NMPI): NITI Aayog uses National Family Health Survey (NFHS) to measure the NMPI.
- The multidimensional poverty in India has declined from 29.17% in 2013-14 to 11.28% in 2022-23 with about 24.82 crore people escaping poverty.
- The Gini index declined from 28.8 in 2011-12 to 25.5 in 2022-23, showing reduced inequality.
Schemes Related to Poverty Alleviation in India
- Dindayal Antyodaya Yojana -National Urban Livelihood Mission (DAY-NULM)
- Pradhan Mantri Awas Yojana-Gramin (PMAY-G)
- Pradhan Mantri Garib Kalyan Yojana (PMGKY)
- Pradhan Mantri Suraksha Bima Yojana
- National Nutrition Mission (POSHAN Abhiyaan)
- Mahatma Gandhi National Rural Employment Guarantee Act (MGNREGA Scheme)
|
Drishti Mains Question: How has India’s approach to poverty measurement evolved from income-based to multidimensional frameworks? |
Frequently Asked Questions (FAQs):
1. What is the World Bank’s definition of poverty?
Poverty is defined as pronounced deprivation in well-being, measured through inadequate income or consumption to meet basic needs.
2. Who developed India’s first official poverty estimates?
The Planning Commission initiated an official poverty assessment in 1962.
3. What was the key shift introduced by the Tendulkar Committee (2009)?
It moved from calorie-based poverty lines to a uniform all-India basket considering health, education, and basic needs, using Mixed Reference Period (MRP) data.
4. What does the National Multidimensional Poverty Index (NMPI) measure?
Using NFHS data, it captures deprivations in health, education, and living standards, reflecting both incidence and intensity of poverty.
UPSC Civil Services Examination, Previous Year Question (PYQ)
Prelims
Q. The Multi-dimensional Poverty Index developed by Oxford Poverty and Human Development Initiative with UNDP support covers which of the following? (2012)
- Deprivation of education, health, assets and services at household level
- Purchasing power parity at national level
- Extent of budget deficit and GDP growth rate at national level
Select the correct answer using the codes given below:
(a) 1 only
(b) 2 and 3 only
(c) 1 and 3 only
(d) 1, 2 and 3
Ans: (a)
Mains
Q. Poverty and malnutrition create a vicious cycle, adversely affecting human capital formation. What steps can be taken to break the cycle? (2024)


