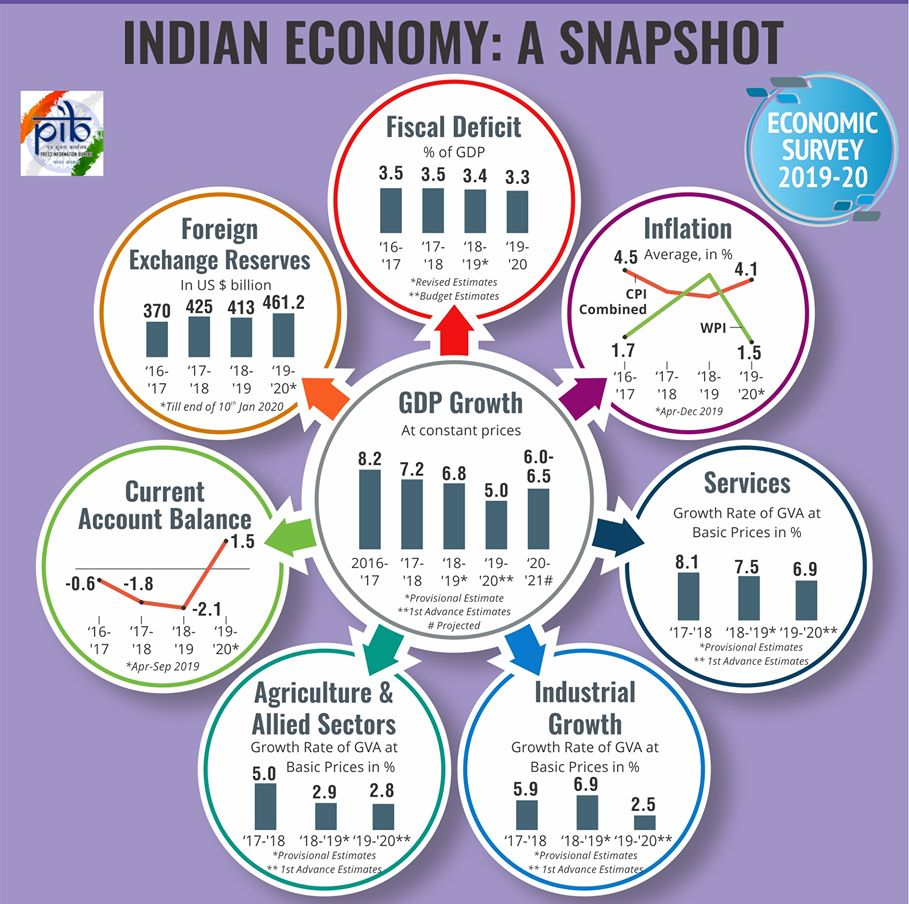
GDP growth pegged at 6-6.5% for 2020-21, up from 5% in 2019-20. The Survey also said that India’s GDP growth is not overstated.
Government Expenditure
The Survey called for rationalization of non-committed revenue expenditures like subsidies as a considerable proportion of revenue expenditure like interest payments, wages and salaries and pensions is committed.
However, the Survey has also warned against cutting capital expenditure.
Share of formal employment increased from 17.9% in 2011-12 to 22.8% in 2017-18 reflecting formalization in the economy.
In 2018, India witnessed an increase of about 80 % in the creation of new firms in comparison to 2014. As per World Bank’s data on Entrepreneurship, India ranks third in the number of new firms created.
Inflation declines sharply from 3.2% in April 2019 to 2.6% in December 2019, reflecting weakening of demand pressure in the economy.
It needs to be noted that when demand surpasses supply, it leads to higher prices i.e. Demand pull inflation.
India’s Balance of Payments (BoP)
The Balance of Payments position improved to USD 433.7 billion in September 2019 because of narrowing Current Account Deficit (CAD) which is 1.5% of GDP in the first half of 2019-20.
Foreign Direct Investment: Net FDI inflows remained buoyant attracting USD 24.4 billion in the first eight months of 2019-20, much higher than the corresponding period of 2018-19.
Remittances
Net overseas remittances in the first half of 2019-20 were more than 50% of total receivables in 2018-19, standing at USD 38.4 billion.
As per World Bank report of 2019, India’s 17.5 million diasporamade it the top remittance-recipient country in 2018.
Merchandise Trade
India’s merchandise trade balance improved from 2009-14 to 2014-19, although most of the improvement in the latter period was due to more than 50% decline in crude prices in 2016-17.
India’s top five trading partners continue to be USA, China, UAE, Saudi Arabia and Hong Kong.
Performance of Key Sectors
Industrial Sector: As per Index of Industrial Production (IIP), the sector registered a growth of 0.6% in 2019-20 (April-November) as compared to 5.0 % during 2018-19 (April-November).
Service Sector: The Services Sector accounted for about 55% of the economy and Gross Value Added (GVA) growth, two-thirds of total FDI inflows into India and about 38% of the total exports.
Agriculture sector
The share of agriculture and allied sectors in the total GVA of the country has been continuously declining on account of relatively higher growth performance of non-agricultural sectors, a natural outcome of development process. Also, livestock income has become an important secondary source of income for millions of rural families.
Agricultural productivity is also constrained by lower level of mechanization in agriculture which is about 40 % in India, much lower than China (59.5 %) and Brazil (75 %).
Ease of Doing Business: Suggestions for Improving Rank in Ease of Doing Business (Rank 63 in 2019)
Close coordination between the Logistics division of the Ministry of Commerce and Industry, the Central Board of Indirect Taxes and Customs, Ministry of Shipping and the different port authorities.
Individual sectors such as tourism or manufacturing require a more targeted approach that maps out the regulatory and process bottlenecks for each segment.