Indian Economy
The Indian Economy: A Review (Part - I)
- 28 Feb 2024
- 40 min read
Important Highlights of the Report
Ahead of the Interim Budget for 2024-25 the Finance Minister presented a 10-year review of the Indian economy.
- Growth Projection: The review predicts that India’s GDP will grow close to 7% in 2024-25, with the potential to go “well above” 7% by 2030.
- The economy is expected to expand from about $3.7 trillion this year to $5 trillion in three years, making it the world’s third-largest, and could even reach $7 trillion by 2030.
- Two Growth Phases: The review divides India’s growth story into two phases:
- 1950-2014 and a “decade of transformative growth” since 2014.
- It highlights that the state of the economy was “far from encouraging” due to structural constraints, tardy decision-making, and high inflation.
- However, post-2014 reforms have restored the economy’s ability to grow healthily, making India the fastest-growing G-20 nation.
- Qualitative Superiority: The review asserts that India’s 7% growth (when the world grows at 2%) is “qualitatively superior” to the 8%-9% achieved during the previous era when the global economy grew at 4%.
Summary of the Report
Chapter-1
Indian Economy: Past, Present And Future
The Indian Growth Story (1950 to 2014)
- Pre-Independence Economic Share:
- India's share of world income declined from 22.6% in 1700 to 3.8% in 1952.
- Post-Independence Economic Strategy (1950s):
- The Indian government adopted a strategy in the 1950s.
- Focused on achieving economic self-sufficiency.
- Rapid industrialisation
- Created large state-owned enterprises (SOEs)
- The decadal average growth rate (1952-60): 3.9%.
- Challenges in the 1960s:
- Slowdown in economic growth during the 1960s.
- Decadal growth rate of 4.1%.
- The 1962 Sino-Indian war.
- 1965-66 India-Pakistan war.
- Severe drought in 1965.
- Slowdown in economic growth during the 1960s.
- Barriers in 1970s:
- Indian rupee devaluation of 57% during the 1970s.
- The 1970s were marked by severe political instability.
- Imposition of Emergency in 1975.
- Decline in decadal average growth rate during the 1970s, reaching 2.9%.
- Reform Initiatives in the 1980s:
- Removal of Price Controls, Initiation of Fiscal Reforms, Revamp of the Public Sector, Reductions in Import Duties, De-licensing of the Domestic Industry, Promotion of Exports
- The 1980s also witnessed greater integration with the global economy, with a focus on promoting exports.
- Modest liberalization combined with significant government spending led to an improvement in Gross Domestic Product (GDP) growth, reaching 5.7% in the 1980s.
- External Shocks in the Early 1990s:
- The breakup of the Soviet Bloc posed an external shock.
- The Iraq-Kuwait war adversely affected trade and disrupted current account balances during 1990–1991.
- The external crisis, unsustainable government spending, and internal socio-political factors led to a Balance-of-Payments (BoP) crisis in 1991.
- Reforms in 1991:
- Eliminating the complex system of rules, permissions, and licenses.
- Reversing the substantial inclination towards state ownership of production facilities.
- Ending the inward-looking trade strategy.
- Real GDP growth averaged 5.8% per annum in the 1990s.
Early 2000s Economic Momentum
- India's Reforms Yield Growth and Capital Influx:
- The growth dividends from transformative reforms implemented during the period 1998-2002 played a key role in economic growth.
- The early 2000s witnessed a global growth boom, and India attracted significant capital flows.
- Key Measures Implemented:
- Sarva Shiksha Abhiyan (SSA): Focused on universal education.
- National Rural Health Mission (NRHM): Implemented to address rural health needs.
- National Rural Employment Guarantee Scheme (NREGS): To provide rural employment.
- Decadal Average Growth Rate: The growth rate in the 2000s was 6.3% per annum.
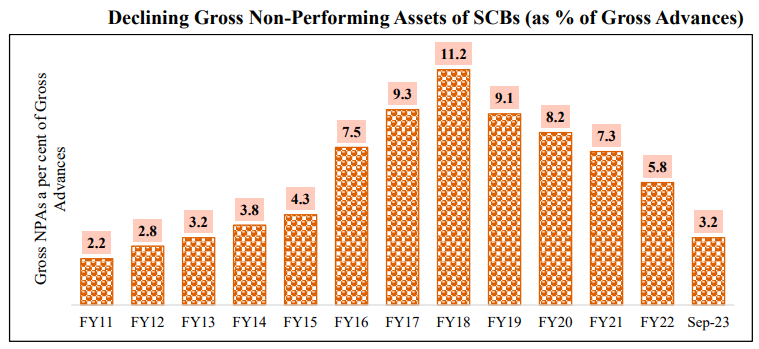
- Impact of Global Financial Crisis (2008): The global financial crisis exposed the fragile foundations of the growth spurt in India.
- Bad debts in banks began to accumulate.
- The bad debt ratio reached double-digit percentages, peaking at 11.2% in March 2018.
- Much of the bad debt originated between 2006 and 2008.
- High Fiscal Deficits and Loose Monetary Policy (2009-2014):
- In the period 2009-2014, the government attempted to sustain high economic growth by running high fiscal deficits and maintaining loose monetary policy for an extended duration.
- Nominal GDP growth remained high during this period.
- India experienced annual double-digit inflation rates for five consecutive years from 2009 to 2014.
- Twin Deficits and Overvalued Rupee:
- India faced high twin deficits, including a fiscal deficit of 4.9% in FY13.
- The current account deficit was also elevated, reaching 4.8% in FY13.
- The Indian rupee was overvalued during this period.
- Crash of Indian Rupee in 2013:
- The Indian rupee experienced a significant crash against the US dollar.
- Between 2009 and 2014, the Indian rupee depreciated annually by 5.9% on average.
- Outcome of Challenges: The combination of high fiscal deficits, loose monetary policy, twin deficits, and the overvalued rupee led to economic growth stalling during this period.
Lessons From the Growth Experience Till 2014
- Transition from Closed to Open Economy (1950-1980):
- Import substitution, export subsidies, stringent restraints on technology and investment cooperation.
- Controls on capacity expansion, licensing requirements for manufacturing industries.
- Pro-Business Reforms Post-1980:
- Import liberalization, export incentives, exchange rate policies, and expansionary fiscal policy.
- These reforms were seen to enhance productivity and boost demand through improved credit availability and high public expenditure.
- Simultaneously, unsustainable investments, questionable loans, opaque allocation of resources, and high fiscal deficits led to a BoP crisis in 1990-91.
- The BoP crisis triggered comprehensive economic policy overhauls, moving towards a market economy.
- Trade policy reforms
- Industrial policy revamping
- Foreign Direct Investment (FDI) liberalization
- Private sector became the major engine of growth and employment generation during the 1990s and 2000s.
- Foreign technologies were denied due to a closed economy, lack of resources, and security reasons.
- Since the 1980s, technology has been progressively used to transform the Indian economy.
- Challenges in the Indian Economy (Pre-2014):
- GDP growth below 5%
- High Wholesale Price Index (WPI) inflation in food articles
- Accentuated structural constraints.
- Structural Constraints:
- Difficulties in quick decision-making .
- Subsidies limiting fiscal space for public investment.
- Especially in capital goods, and low-value addition in manufacturing.
- Presence of a large informal sector and insufficient labor absorption in the formal sector.
- Low agricultural productivity due to intermediaries, storage shortages, and inter-state movement issues.
2014 - 2024: Decade of Transformative Growth
- Structural Reforms and Macroeconomic Fundamentals (Since 2014):
- The Government of India initiated several structural reforms strengthening macroeconomic fundamentals.
- India emerged as the fastest-growing economy among G20 nations.
- Estimated growth of 7.3% in 2023-24 following 9.1% (FY22) and 7.2% (FY23).
- Post-Pandemic Recovery and Job Generation:
- Urban unemployment rate dropped to 6.6%.
- Net new Employees' Provident Fund Organisation (EPFO) subscribers in the age group 18-25 consistently exceeded 55% of the total net new EPF subscribers since May 2023.
- Infrastructure Development:
- Record expansion of road, rail, and air networks.
- 74 airports were built in the last nine years and the number of universities increased from 723 in 2014 to 1,113 in 2023.
- Gross Enrolment Ratio (GER) for girls increased to 27.9% in 2020 from 12.7% in FY10.
- Total enrolment in higher education rose from 3.4 crore in 2014 to 4.1 crore students in 2023.
- Effective Crude Oil Management and Fiscal Support:
- Government provided a 50-year interest-free loan of ₹1 lakh crore to states in FY23 and announced another ₹1.3 lakh crore in FY24.
- States utilized more than ₹97,000 crore out of the ₹1.3 lakh crore of interest-free loans for capital investment in the first eight months of FY24.
- States' Capital Expenditure Increase:
- States capital expenditure increased by more than 47% in the first six months of April-September 2023 compared to the same period in 2022.
Drivers of India’s Growth in the Last Decade
- Financial Sector Reforms (Post-2020):
- Addressing the financial system crisis post-2020 with reforms such as recapitalization, Public Sector Banks (PSB) merger, and amendments to the Securitization and Reconstruction of Financial Assets and Enforcement of Security Interest (SARFAESI) Act, 2002.
- Implementation of Insolvency and Bankruptcy Code (IBC) facilitated the clean-up of balance sheets.
- Simplification of Regulatory Frameworks and Reforms (Since 2014):
- Enactment of Real Estate (Regulation and Development) Act, 2016 promoting transparent transactions and reducing black money circulation.
- Introduction of Goods and Services Tax (GST), reduction in corporate and income tax rates, exemption for sovereign wealth funds and pension funds, and removal of Dividend Distribution Tax to reduce the tax burden on individuals and businesses.
- Enhanced tax base, reduced compliances, formalization of the economy, and consistently rising monthly gross collections.
- Private Sector Engagement and Disinvestment Policy:
- Revival of the disinvestment policy, introducing New Public Sector Enterprise (PSE) Policy for Aatmanirbhar Bharat to minimize government presence in PSEs.
- Introduction of initiatives to enhance manufacturing capabilities, promote exports, and provide Production Linked Incentives (PLI).
- Ease of Doing Business and MSME Sector Reforms:
- Decriminalization of minor economic offenses under the Companies Act, 2013, resulting in ease of doing business.
- Elimination of 25,000 unnecessary compliances and repeal of over 1,400 archaic laws.
- Introduction of initiatives such as Emergency Credit Line Guarantee Scheme (ECLGS), redefinition of MSMEs under Aatmanirbhar Bharat, TReDS for addressing delayed payments, and extension of non-tax benefits for MSMEs.
- Public Spending on Infrastructure (Since 2014):
- Effective Capital Expenditure by the Union government rose from 2.8% of GDP in FY14 to 4.5% in 2023-24 (BE).
- Programs like Bharatmala, Sagarmala, UDAN, and others addressing infrastructure and logistics bottlenecks.
- Inclusive Growth Policies (Last Decade):
- Over 10.11 crore women are given free gas connections.
- Construction of 11.72 crore toilets for the poor.
- Opening of 51.6 crore Jan Dhan accounts.
- Over 6.27 crore hospital admissions under the Ayushman Bharat Scheme.
- Construction of 2.6 crore pucca houses for the poor.
Challenges Confronting the Indian Economy
- Energy Security and Transition:
- Balancing energy security and economic growth against the need for energy transition poses multifaceted challenges.
- Policy actions related to energy choices have geopolitical, technological, fiscal, economic, and social dimensions.
- Artificial Intelligence (AI) and Employment:
- The advent of AI raises concerns about its impact on employment, particularly in service sectors.
- An IMF paper estimates that 40% of global employment is exposed to AI, emphasizing the need for investment in infrastructure and a digitally skilled labor force in developing economies.
Track Record of Overcoming Challenges
- Pradhan Mantri Kaushal Vikas Yojana (PMKVY): Aims to provide relevant industry skill training to Indian youth for better livelihoods, with around 1.3 crore candidates trained and 24 lakh individuals placed as of December 2023.
- Renewable Energy Promotion: Focused efforts to promote manufacturing and use of renewable energy, resulting in a combined installed capacity of 179.57 GW from renewable sources, including large hydropower, as of November 2023.
- Internet Penetration: Internet penetration in India crossed 50% in 2022, growing three-fold since 2014.
- Aadhar Implementation: Aadhar facilitated the transfer of over ₹34 lakh crores to more than 1167 crore beneficiaries under Direct Benefit Transfer (DBT), with over 200 crore Aadhaar-based authentications monthly.
- Financial Inclusion: Prime Minister’s Jan Dhan Yojana reached 51.5 crore beneficiaries as of January 10, 2024, with a 3.5-fold growth since March 2015. Notably, 56% of account holders are women, and two-thirds are in rural and semi-urban areas.
- Covid-19 Response: Successful implementation of one of the world's largest vaccination programs using the CoWin app, administering 221 crore vaccine doses to the population aged 18 years and above.
- Technological Leap in Space Exploration: Launched 431 foreign satellites, with 396 launched since June 2014, showcasing advancements in space technology.
- Proactive Approach: India's 'Mission Mode' approach has been effective in addressing challenges, both existing and emerging.
- Adaptability: The country's ability to convert disadvantages into strengths and use technology for inclusive growth demonstrates adaptability and resilience.
- Growth Outlook: India's growth is estimated at 7.3% in FY24, with expectations of sustained strong growth.
- Current Account Deficit: Lowering current account deficit to 1% of GDP in FY24.
- MSME Focus: Reforms unleashing the productive potential of India’s MSMEs with streamlined regulatory and compliance obligations.
- Land Availability: Ensuring land availability at reasonable prices.
- Energy Needs: Measures addressing the energy needs of the growing economy.
- G20 Presidency: Successful hosting of G20 Presidency, marking India's arrival as a key consensus builder on the global stage.
- Chandrayaan-3: Successful reach to the South Pole of the Moon.
- 5G Deployment: Achieved the fastest deployment of 5G globally.
Global Significance and Trust
- Global Presence: Growing importance in the global economic landscape.
- Global Achievements: Major strides in various fields, including space exploration and technology deployment.
- Citizen Resilience: Path reflects the resilience and determination of Indian citizens founded on trust.
Chapter-2
Key Factors Responsible for the Resilience of the Indian Economy
- Post-Pandemic Recovery:
- Above-7% Growth: Displayed resilience with two consecutive years of above-7% growth post the pandemic-induced contraction in FY21.
- Potential Third Year: On track for a third year of above-7% growth in FY24.
- Performance in FY24:
- Achieved 7.6% growth in real terms in the first half of FY24 compared to the first half of FY23.
- First Advance Estimates by National Statistical Office Estimate indicate an estimated real GDP growth of 7.3% in FY24, exceeding forecasts by various agencies.
- Positive Estimates:
- Estimates from the National Statistical Office exceeding forecasts made by various national and international agencies.
- Possibility of growth surpassing the RBI's projection of 7%, indicating robust economic performance.
- Resilience in Multiple Dimensions:
- Economic Growth:
- Resilience evident in declining unemployment rates and rising economic activity.
- Healthy performance in high-frequency indicators, including E-way bill generation, rail freight, and port cargo traffic.
- Infrastructure focus and housing demand driving construction activity, reflected in increased steel consumption and cement production.
- Mobility, particularly air travel, exceeded pre-Covid levels despite pandemic challenges.
- Banking Sector and Fiscal Discipline:
- Strong balance sheets of public sector banks rooted in RBI's Asset Quality Review, recapitalization, and enactment of the Insolvency and Bankruptcy Code (IBC).
- Continuity of Growth Drivers:
- Simultaneous pursuit of energy security and energy transition without derailing high growth, underway before the pandemic.
- Resilience built on pre-pandemic domestic demand, a crucial pillar supporting the Indian economy.
- Government Measures Over Ten Years:
- Identified measures across four blocks - Domestic Economy, Macroeconomic Stability, Human Resources, and External Economy.
- Building resilience to climate change, enabling the pursuit of energy security and transition without conflict.
- Economic Growth:
- Domestic Economy:
- Consistent Post-Covid Recovery:
- Estimated to grow at an average of 7.9% between FY22 and FY24.
- Few economies globally have maintained post-Covid recovery as consistently as India.
- Sectoral Contributions:
- Manufacturing Sector’s share in Gross Value Added (GVA) increased from 17.2% (FY14) to 18.4% (FY18) due to the Make in India mission. Remained robust at 17.7% (FY24) with Production Linked Incentive (PLI) schemes.
- Construction Sector’s share in total GVA was 8.8% (FY14) and almost recovered to 8.7% (FY24) after countering real estate price increases and pandemic challenges.
- Service Sector’s share in total GVA increased from 51.1% (FY14) to 54.6% (FY24) due to the pandemic and subsequent unlocking, leading to a surge in non-contact services. Government's drive towards digitalization, represented by India Stack, plays a substantial role.
- Private Final Consumption Expenditure (PFCE):
- PFCE's share in GDP at current prices increased from an average of 58.4% in the eight years preceding the pandemic to 60.8% in the last three years ending FY24.
- Consistent Post-Covid Recovery:
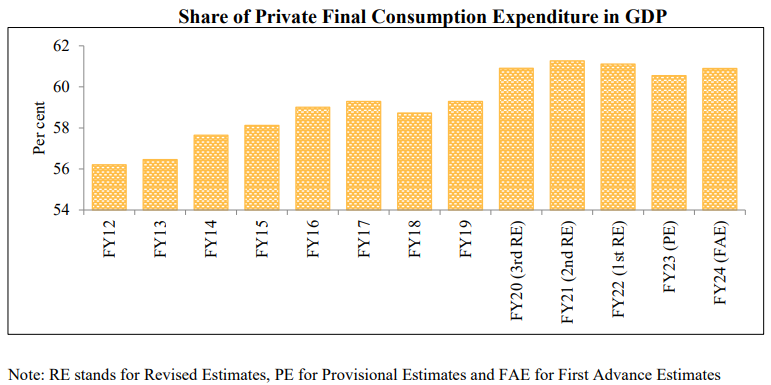
- Role of PFCE in Post-Covid Growth:
- Private Final Consumption Expenditure (PFCE) has emerged as a major growth driver post-Covid pandemic.
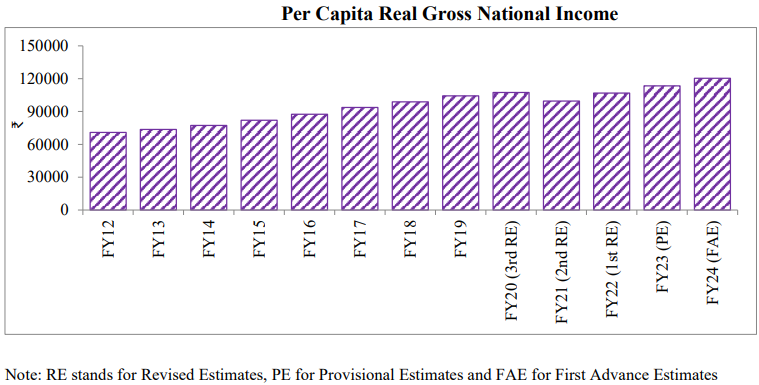
- India has emerged as the fastest-growing major economy, supported by a resilient PFCE.
- Robust increase in Per Capita Real Gross National Income (GNI) in the nine years before the pandemic.
- Registered a Compound Annual Growth Rate (CAGR) of 5.3% from FY12 to FY20.
- Strong government vision, market-friendly reforms, reduced compliance burden, simplified laws, opening up of sectors, and strategic disinvestment of public sector enterprises contributed to private sector growth.
- Foreign Investment and Financial Sector:
- The government has implemented investor-friendly policies, allowing 100% FDI under the automatic route in most sectors.
- Policymakers contributed to nursing the financial sector back to health.
- Pragmatic monetary policy and coordination of economic and monetary policies played a significant role.
- Components of PFCE Growth:
- The increase in Private Final Consumption Expenditure (PFCE) is balanced across durables, semi-durables, and services.
- After witnessing a decline in FY21, durables, semi-durables, and services registered double-digit growth in FY22.
- SEBI's enhanced market transparency, increased retail participation in the stock market, and growth in demat accounts generated the wealth effect.
- Government's boost to infrastructure investment created additional employment and incomes, strengthening PFCE.
- Digital Infrastructure and Economic Potential:
- Digitalization enhanced financial inclusion, formalization of the economy, efficient service delivery, and transparent governance processes.
- Digitalization directly helped increase private consumption, both pre and post-pandemic.
- Aarogya Setu and CoWin apps were game-changers during the pandemic, facilitating tracking, containment, and vaccination efforts.
- The pandemic led to shifts in behavior, including virtual healthcare visits, digital payments, and accelerated grocery shopping.
- Digital payment systems like UPI aided the growth of e-commerce, with a projected CAGR of 16% between 2022 and 2026.
- Rural Inclusiveness and Welfare Approach:
- Rural India showed increasing social and economic inclusiveness.
- PMJDY provided low-cost bank accounts, and DBT eased the direct transfer of benefits to these accounts, narrowing the rural-urban divide.
- The government's all-inclusive welfare approach is expected to contribute to expanding the middle class.
- Transformation in Investment Climate:
- The seemingly impressive investment rate in the first decade relied on excessive borrowing and over-optimism, leading to an unsustainable situation.
- Banks were reluctant to lend to corporates in the second decade, resulting in a decrease in the investment share of GDP.
- Stresses on balance sheets accumulated in the first decade, contributing to macro fragility, high fiscal deficit, high current account deficit, and sustained double-digit inflation.
- India was included in the infamous club of 'fragile-five' emerging economies.
- Government Initiatives:
- The government took measures to help banks strengthen their balance sheets by recapitalizing them and restructuring the industry.
- Stronger balance sheets in the non-financial corporate sector and banking sectors have been achieved.
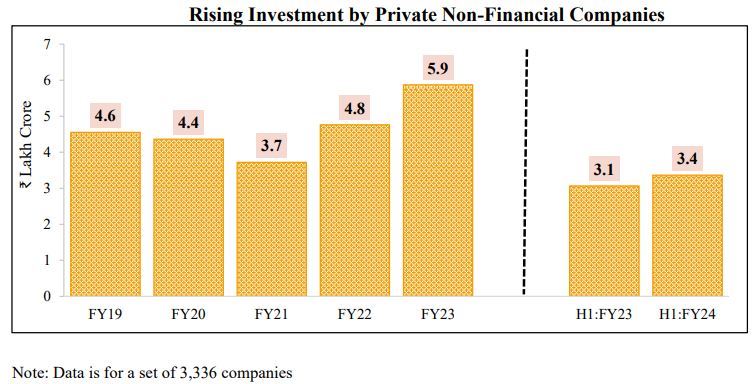
- Outlook for Investments:
- Growth in investments and credit has shown positive trends in the last three years.
- Data presented in Charts 3 and 4 support the assertion that investments and credit are poised to increase in the current decade.

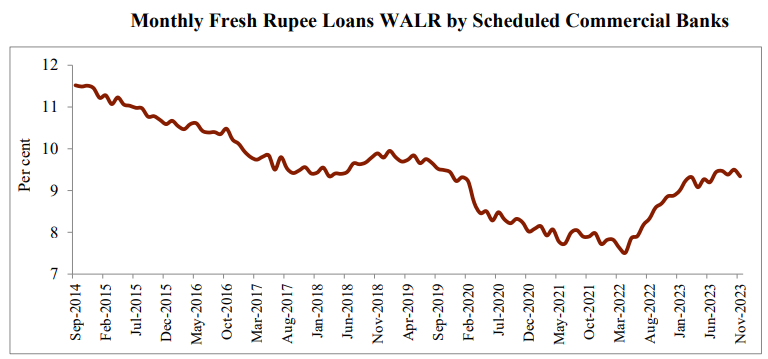
- Government Efforts and Positive Outcomes:
- Efforts have resulted in healthier balance sheets, both in the private corporate sector and banking sector.
- Positive outcomes include private corporate investment beginning to increase.
- Banks are responding with increased credit disbursement.
- Non-Food Bank Credit Growth:
- Non-food bank credit growth, net of personal loans, had experienced a decline from above 20% in 2008 to less than 10% in FY 2016.
- There has been a rebound, reaching 13% in FY23 (Chart 4).

- Public Sector Capital Expenditure (FY15 to FY24):
- Public sector capital expenditure, including Union government capex, grants to states for capital asset creation, and Central PSEs' investment resources, increased from ₹5.6 lakh crore in FY15 to ₹18.6 lakh crore in FY24.
- Surge in capital expenditure was 5.1 times during this period.
- Grants to states for capital asset creation increased by 2.8 times, and resources of PSEs increased by 2.1 times.
- Rebalancing Fiscal Expenditure (FY18 to FY24):
- To facilitate the upscaling of capital expenditure, the Union government rebalanced its fiscal expenditure.
- Capital spending rose from 12% of total expenditure in FY18 to 22% in FY24 (Budget Estimate).
- Emphasis on Infrastructure Investments:
- The emphasis on infrastructure investments aims to address long-standing supply-side deficiencies in the Indian economy.

- Government Measures to Boost Infrastructure:
- The government accelerated work on a large pipeline of stalled infrastructure projects by addressing issues like construction delays, administrative inefficiencies, financing challenges, legal complexities, and land issues.
- The government digitized bureaucratic procedures, streamlined project approvals, eased legal constraints, reduced corporate tax rates, implemented a uniform GST regime, and opened new avenues for private investors.
- The Pragati/Project Monitoring Group (PMG) mechanism has played a crucial role in expediting the execution of long-delayed projects.
- Proxy Indicators for Private Capex Upsurge:
- Multiple proxy indicators and industry reports suggest the emergence of green shoots of a private capex upcycle in the post-pandemic years.
- The Index of Industrial Production (IIP) data indicates robust growth in the capital goods index (12.9%) and infrastructure/construction goods index (8.4%) in FY23.
- Listed/unlisted corporates indicate expanding private investment in the first half of FY24.
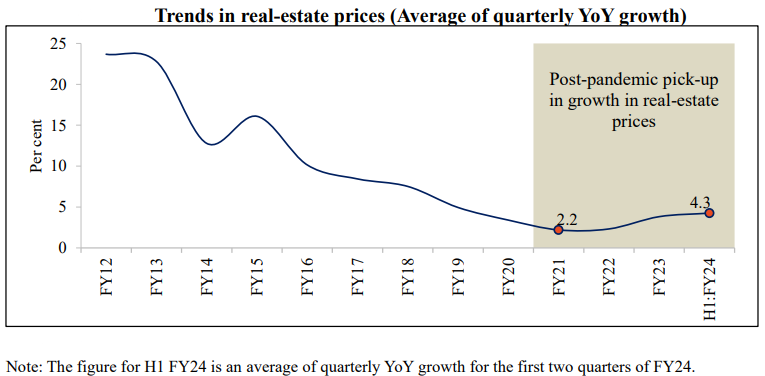
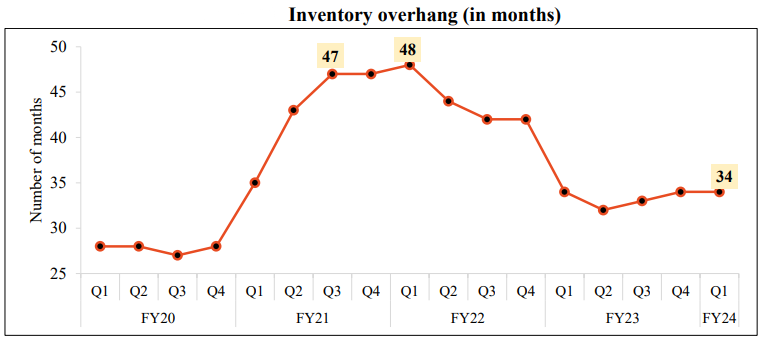
- Rising Household Investments in Real Estate Strengthens the Investment Rate:
- Household Sector Investment Contribution:
- Household sector investment constitutes the largest share in the total Gross Fixed Capital Formation.
- Household sector investment was on a rising trajectory just before the pandemic.
- The growth in real-estate prices showed a gradual decline, and there was a continued increase in bank credit for housing, contributing to the rise in household sector investment.
- After the pandemic, there has been a recovery in housing prices, with the average annual growth increasing from 2.3% in FY22 to 4.3% in H1 of FY24.
- The uptrend in housing sales and launches, despite factors like increased real-estate prices and higher interest rates, indicates the strength of the recovery of incomes and optimism about the future.
- Household Sector Investment Contribution:


- Sustained Increase in Investment Rate:
- The overall investment rate of the economy for the last three years has consistently surpassed the levels of FY16 relative to GDP.
- The increase in investments is driven by all three sectors of the economy - public sector, private sector, and households.
- This reflects confidence in the future economic prospects of the country.
- The sustained increase in the investment rate is expected to lay the foundation for investment-led growth in the Indian economy over the next decade.
Agricultural Sector Policies Ensuring Food Security
- Agricultural Sector Contribution:
- Agriculture constitutes 18% of India's Gross Value Added (GVA) in FY24.
- Grew at an average annual rate of 3.7% from FY15 to FY23, compared to 3.4% from FY05 to FY14.
- Total food grains production for FY23 was 329.7 million tonnes, marking a rise of 14.1 million tonnes.
- India's global dominance in agricultural commodities: largest producer of milk, pulses, and spices.
- Second-largest producer of various commodities, including fruits, vegetables, tea, farmed fish, sugarcane, wheat, rice, cotton, and sugar.
- Agricultural exports reached ₹4.2 lakh crore in FY23, surpassing previous records.
- Government Initiatives:
- Consistent increase in Minimum Support Prices (MSPs) for 22 crops.
- Policy initiatives such as PM-KMY, PM-KISAN, and PMFBY provide financial and income support to farmers.
- Digital inclusion and mechanization promoted productivity.
- Launch of e-NAM (National Agriculture Market) in 2016 facilitating online trading of agricultural commodities.
- Affordable drone technology made available to farmers.
- Efforts to strengthen cooperative movement and creation of Agristack for effective planning and implementation of schemes.
- Focus on post-harvest infrastructure investment, sustainable agriculture practices, and promotion of natural farming.
- Food Security Measures:
- Timely and efficient procurement and distribution of food grains.
- Wheat procurement surpasses last year's total, reaching 262 LMT.
- Pradhan Mantri Annadata Aay Sanrakshan Abhiyan (PM-AASHA) scheme introduced in 2018.
- Extension of Pradhan Mantri Garib Kalyan Anna Yojana (PMGKAY) for five years starting from January 1, 2024.
Reform Push to the Indian Industry
- Industrial Growth:
- Industrial growth accelerated to 7.1% per annum from FY15 to FY19 compared to 5.5% in FY10 to FY14.
- Despite a short-lived contraction due to the COVID-19 pandemic, Indian Industry is likely to record a robust 8% growth per annum during the triennium ending March 2024.
- Government Initiatives:
- Make in India:
- Targeted measures under 'Make in India' initiative to bolster domestic manufacturing.
- Production-Linked Incentive (PLI) scheme covering 14 sectors to incentivize manufacturers.
- Over ₹1.07 lakh crore investment, ₹8.7 lakh crore production/sales, and employment generation of over 7 lakh under PLI scheme.
- Startup India:
- 1.14 lakh startups recognized, creating more than 12 lakh jobs.
- Open Network for Digital Commerce recorded more than 6.3 million transactions in November 2023.
- Regulatory reforms, including the decriminalization of 3,600 compliances, improved ease of doing business.
- MSME Support:
- Vibrant and dynamic MSMEs with supportive measures.
- Union Budget for FY24 facilitating timely receipt of payments for MSMEs.
- Udyam portal and Udyam Assist Platform (UAP) consolidating MSME information.
- PM Vishwakarma, offering support to artisans, attracting 48.8 lakh enrolments.
- Credit Schemes:
- Pradhan Mantri Mudra Yojana disbursed ₹25.98 lakh crore to small and micro enterprises.
- Credit Guarantee Fund Trust for Micro & Small Enterprises (CGTMSE) limit raised to ₹5 crore.
- Emergency Credit Line Guarantee Scheme (ECLGS) provided guarantees of ₹2.4 lakh crore.
- Make in India:
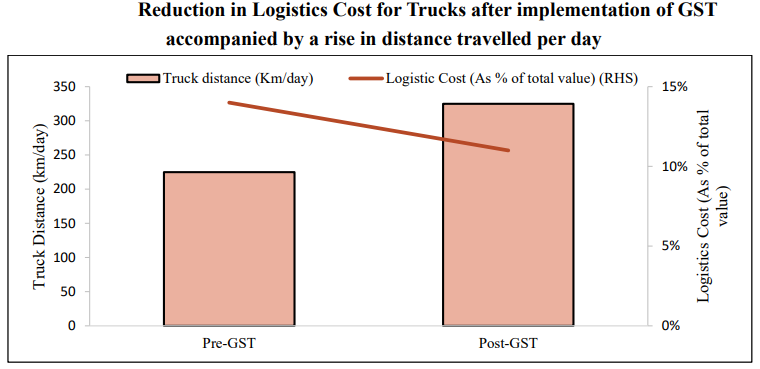
- Logistics and Infrastructure:
- Unified Logistics Interface Platform (ULIP) under the National Logistics Policy integrated with 35 systems of 8 ministries, with 699 industry players registered.
- Logistics cost in the economy reduced by 0.8 to 0.9 percentage points of GDP between FY14 and FY22.
- Average turnaround time at major ports decreased from 4.2 days (FY04-FY14) to 2.9 days (FY14-FY22).
- Government's capex push reduced logistics costs, bolstered the construction industry, and contributed to around 12% per annum growth in construction from FY22 to FY24.
Digital Infrastructure and Delivery of Citizen-Centric Services
- Digital Public Infrastructure (DPI) - India Stack:
- Three interconnected layers: Identity Layer (Aadhaar), Payments Layer (UPI, Aadhaar Payments Bridge, Aadhaar Enabled Payment Service), and Data Layer (Account Aggregator).
- Identity Layer (Aadhaar) provided digital identity to every Indian.
- Payments Layer witnessed a surge in cashless payments, especially during the pandemic.
- Data Layer transformed the authentication ecosystem, reducing e-KYC costs from ₹1000 to ₹5.
- PMJDY and Direct Benefit Transfers (DBT):
- PMJDY utilized India Stack for direct benefit transfers into beneficiaries' bank accounts.
- PMJDY accounts grew threefold from 14.7 crore in March 2015 to 51.5 crore as of January 10, 2024.
- DBT mode transferred more than ₹33.6 lakh crore (as of December 2023).
- Financial Inclusion and Fintech Growth:
- 100% FDI in the telecom sector and prohibition of discriminatory data tariffs increased competition.
- Average monthly data consumption per wireless data subscriber increased almost 300 times to 18.4 GB in June 2023 from 61.7 MB in March 2014.
- India among the fastest-growing fintech markets globally, third-largest after the USA and the UK.
- Global Capability Centres (GCCs):
- Sharp increase in business services exports linked to the proliferation of Global Capability Centres (GCCs) in India.
- GCCs account for more than 1% of India's GDP.
Return of Credit Creation
- Bank Credit Growth:
- Outpaced the growth in deposits.
- Non-food bank credit grew at 15% in FY23, the highest in the last decade.
- Asset Quality Improvement:
- Improvement in asset quality across all Scheduled Commercial Bank (SCB) groups.
- Downward trend in the ratio of GNPAs and Net NPAs relative to total advances. Signifies a positive shift in asset quality, reducing non-performing assets.
- Global Ranking Improvement:
- India's global ranking in resolving insolvency parameters improved from 136 to 52 in the first three years of IBC implementation.
- Recapitalization Measures:
- Government recapitalization measures helped improve profit margins of public sector banks (PSBs).
- Corporate profit margins increased due to the resolution of stressed assets, saving costs on debt servicing.
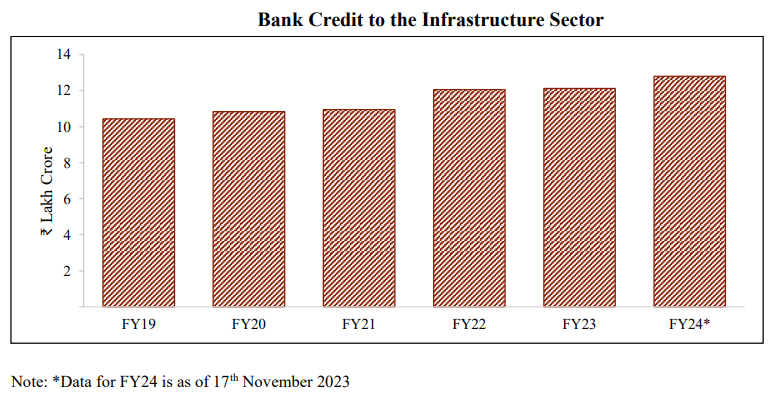
- Credit Disbursal to MSMEs and Infrastructure Sector:
- Bank credit to MSMEs registered a CAGR of 14.2% from FY19 to FY24.
- Recent government emphasis on capital expenditure strengthened the credit cycle, with growing bank credit disbursal to the infrastructure sector.
Evolving Financial Markets to Support the Investment Needs of a Growing Economy
- India's Equity Market Surge and Digital Revolution:
- Indian equity markets have outshone global counterparts, delivering an impressive CAGR of approximately 13.5% between January 2014 and December 2023.
- Volatility in 2023, measured by the standard deviation of the BSE Sensex, has decreased to levels last observed in 2019, reflecting increased stability.
- Adoption of digital technology has significantly enhanced retail investors' access to financial markets, evidenced by a remarkable 536% growth in demat accounts, reaching 13.9 crore by December 2023 from March 2014.
- IPO Activity: SME Segment Flourishing:
- Since FY15, a total of 1,050 companies have collectively raised ₹3.9 lakh crore through IPOs, showcasing the buoyancy in the market.
- Sustained IPO activity has positioned the Indian market as the fifth-largest globally by market capitalization.
- India's market capitalization to GDP ratio has witnessed a significant improvement, rising from 79% in 2014 to an impressive 104% by the end of 2022.
- India's robust equity market performance has translated into the second-largest weightage in the MSCI Emerging Markets index.
- The Indian corporate bond market has experienced substantial growth, doubling from ₹43 lakh crore in FY24 to a projected ₹100-120 lakh crore in FY30, according to CRISIL.
- Initiatives Driving Bond Market Development:
- Introduction of sovereign green bonds and regulatory measures by SEBI for instruments like InvITs and Municipal Bonds have contributed to the deepening and widening of the bond market.
- Large corporations listed on exchanges are mandated to fulfill 25% of their financing needs through the issuance of debt securities, promoting market growth.
- India's financial markets are anticipated to play a pivotal role in financing the nation's capital investment requirements in the future.
- Access to financial markets is expected to facilitate a broader pool of investors, allowing for diversified investments and safer savings growth.
Safeguarding Macroeconomic Stability
- Macroeconomic Stability Goals:
- The government and the Reserve Bank of India aim for macroeconomic stability, which includes strong output growth, price stability, and a robust external account.
- Institutional architecture has been committed to fostering macro stability in the face of multiple challenges.
- Inflation Targeting:
- The period between FY09 and FY14 saw high average retail inflation, but since FY16, flexible inflation targeting has been adopted within the band of 4 +/- 2 per cent under the Monetary Policy Framework Agreement.
- The Price Stabilization Fund (PSF) has been effective in managing price volatility in agri-horticultural commodities.
- Despite challenges during the Covid-19 pandemic, inflation was kept within the 2 to 6 per cent range, aided by the PSF and improved fiscal and external balances.
- Post-Pandemic Challenges and Response:
- FY22 witnessed an economic revival, but by the end of FY22, global economic conditions worsened due to geopolitical conflicts and sanctions.
- Elevated global commodity prices, especially crude oil, and supply chain disruptions posed challenges.
- The government diversified energy supply sources to insulate the economy from vulnerabilities, contributing to India's growth revival.
- Inflation Trends:
- Inflationary pressures moderated in FY24, with average retail inflation easing to 5.5 per cent.
- Core inflation reached a 49-month low of 3.8 per cent in December 2023.
- Overall retail inflation is stable and within the notified tolerance band of 2 to 6 per cent.
- Food Inflation Challenges and Mitigation:
- Global and domestic challenges, including untimely rains and weather-driven supply chain disruptions, impacted food prices.
- Supply-side initiatives, periodic open market releases, trade policy measures, and anti-hoarding measures helped keep food inflation at moderate levels, lower than many large economies.

- Monetary Policy Support:
- Supportive monetary policy by the Reserve Bank of India, including a progressive increase in the policy repo rate, aimed at aligning inflation with the target while supporting growth.
- The RBI projected that inflation would average 5.4 per cent in FY24 within the notified tolerance level.
- Future Outlook:
- With likely improvements in the fiscal balance and external current account balance, macro vulnerabilities are expected to moderate.
- The government and the RBI have implemented a comprehensive approach, including inflation targeting, fiscal measures, and supply-side initiatives, to achieve and maintain macroeconomic stability in India despite various challenges.


