Indian Economy
ASI Results for 2020-21 and 2021-22
- 10 Feb 2024
- 9 min read
For Prelims: Annual Survey of Industries, Gross Value Added, Gross Domestic Product (GDP), Net Value Added, National Statistical Office (NSO)
For Mains: Gross Value Added and its significance in assessing economic growth, Annual Survey of Industries (ASI), Growth & Development
Why in News?
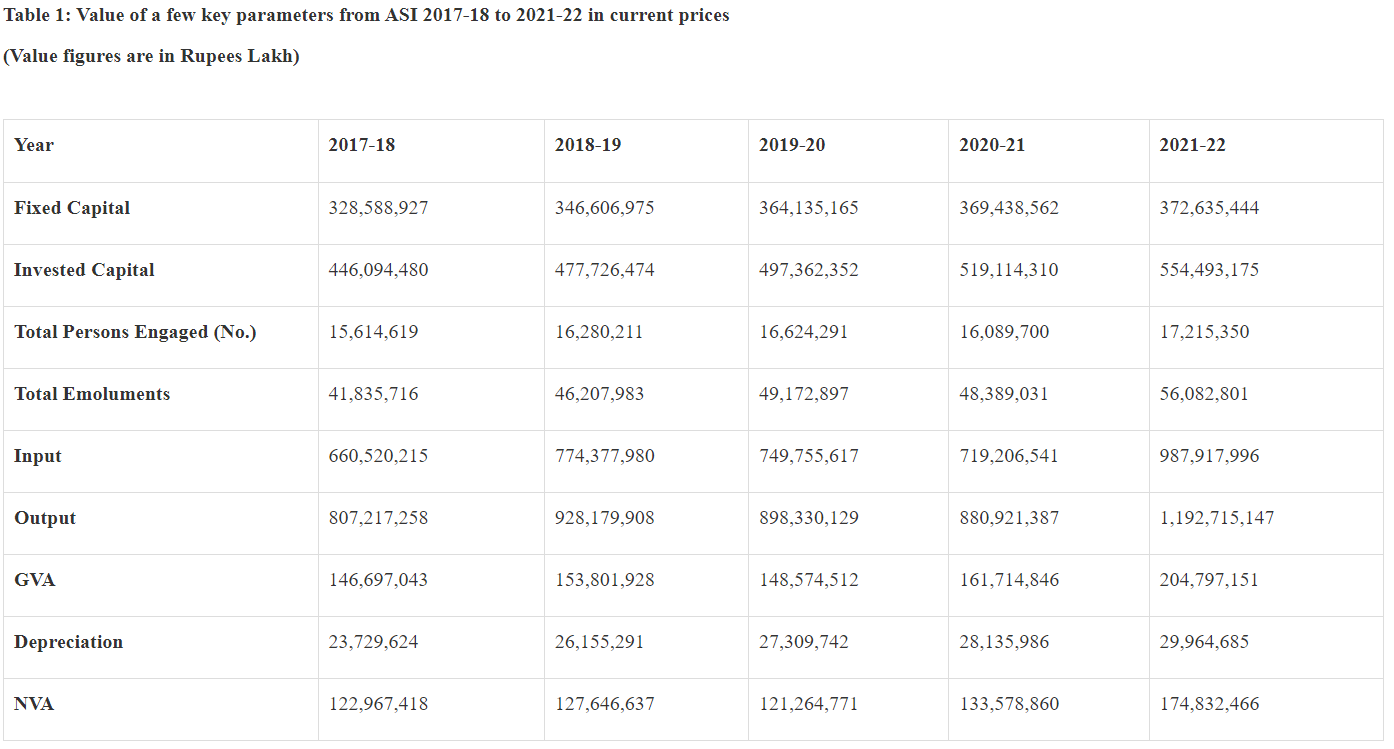
Recently, the Ministry of Statistics and Programme Implementation (MoSPI) released the results of the Annual Survey of Industries (ASI) for the reference periods of 2020-21 and 2021-22 referred to as ASI 2020-21 and ASI 2021-22.
What are the Key Highlights From the ASI 2020-21 and ASI 2021-22 Results?
- Growth in Gross Value Added (GVA):
- GVA grew by 8.8% in the year 2020-21 over 2019-20, primarily due to a sharp fall in input (4.1%) that offset an output contraction (1.9%) during the pandemic.
- In 2021-22, GVA surged significantly by 26.6% over the previous year, riding on high growth in industrial output, which expanded by more than 35% in value terms.
- The year 2021-22 witnessed a sharp rise in level as well as in the growth of the majority of the important economic parameters like invested capital, input, output, GVA, net income and net profit registered by the sector and even surpassed the pre-pandemic level in absolute value terms.
- Key Industry Drivers:
- Industries such as Manufacture of Basic Metal, Coke & Refined Petroleum Products, Pharmaceutical Products, Motor vehicles, Food Products, and Chemical and Chemical products emerged as major drivers of growth.
- Together, these industries contributed about 56% of the total GVA of the sector, with a GVA growth of 34.4% and output growth of 37.5% compared to 2020-21.
- Industries such as Manufacture of Basic Metal, Coke & Refined Petroleum Products, Pharmaceutical Products, Motor vehicles, Food Products, and Chemical and Chemical products emerged as major drivers of growth.
- Regional Performance:
- Gujarat remained at the top in terms of GVA in 2020-21 and second in 2021-22, while Maharashtra ranked first in 2021-22 and second in 2020-21.
- Tamil Nadu, Karnataka, and Uttar Pradesh consistently maintained their positions among the top five states contributing to manufacturing GVA.
- Gujarat remained at the top in terms of GVA in 2020-21 and second in 2021-22, while Maharashtra ranked first in 2021-22 and second in 2020-21.
- Employment Trends:
- Despite a marginal fall in employment in 2020-21 due to the pandemic, 2021-22 saw robust growth of 7.0% year-on-year (Y-o-Y) in total estimated employment in the sector.
- The estimated number of persons engaged in the sector in 2021-22 exceeded pre-pandemic levels by more than 9.35 lakh, with the average salary per employee registering an increase of 1.7% in 2020-21 and by 8.3% in 2021-22 in comparison to respective previous years.
- Tamil Nadu, Gujarat, Maharashtra, Uttar Pradesh, and Haryana emerged as the top five states employing the highest number of persons in the manufacturing sector in both 2020-21 and 2021-22.
- Together, these states contributed about 54% of total manufacturing employment in both years.
- Despite a marginal fall in employment in 2020-21 due to the pandemic, 2021-22 saw robust growth of 7.0% year-on-year (Y-o-Y) in total estimated employment in the sector.
Gross Value Added (GVA)
- GVA measures the value producers add to goods and services during production.
- It's calculated by subtracting the cost of inputs (intermediate consumption) from total output.
- It's a key component of Gross Domestic Product (GDP), reflecting economic growth. GVA growth rates provide insights into sectoral performance, aiding economic analysis and policymaking.
- GVA = GDP + subsidies on products - taxes on products.
- If we deduct the depreciation from GVA we get Net Value Added (NVA).
- NVA is the value of output less the values of both intermediate consumption and consumption of fixed capital.
What is the Annual Survey of Industries (ASI)?
- About:
- The Annual Survey of Industries (ASI) is the principal source of industrial statistics in India. It started in 1960 with 1959 as the base year and continues annually except for 1972, under the Collection of Statistics Act, of 1953.
- From ASI 2010-11, the Survey is being conducted under the Collection of Statistics Act, 2008.
- The Collection of Statistics Act, 2008 has been amended in 2017 as the Collection of Statistics (Amendment) Act, 2017 which extends the coverage to All India.
- The National Statistical Office (NSO) conducts the ASI. The NSO is part of the MoSPI.
- The MoSPI is responsible for the coverage and quality of released statistics.
- Scope and Coverage:
- ASI covers factories registered under Sections 2(m)(i) and 2(m)(ii) of the Factories Act, 1948.
- Bidi and cigar manufacturing establishments registered under the Bidi & Cigar Workers (Conditions of Employment) Act,1966.
- Electricity undertakings engaged in generation, transmission and distribution of electricity, not registered with the Central Electricity Authority (CEA).
- Units with 100 or more employees registered in the Business Register of Establishments (BRE) prepared and maintained by the State Governments as and when such lists are shared by the respective State Governments.
- Data Collection Mechanism:
- Data for ASI are collected from the selected factories under the Collection of Statistics Act 2008 as amended in 2017 and Rules framed there under in 2011.
India's Industrial Sector
- India has witnessed a significant shift in its manufacturing dynamics. Traditionally known for its prowess in textiles, handicrafts, and agro-based industries, the nation has diversified its manufacturing portfolio.
- There has been a consistent recovery in industrial production after the Covid-19 pandemic.
- In the FY 2021-22, industrial production recovered from the Covid pandemic and registered a double-digit growth of 11.4%. Industrial production further expanded by 5.2% in FY 2022-23.
- During the April to October period of FY 2023-24, Index of Industrial Production (IIP) registered a cumulative growth of 6.9% over the corresponding period of the previous year.
- Index of Manufacturing, Mining and Electricity sector grew by 6.4%, 9.4% and 8.0% respectively during the aforesaid period.
- In the FY 2021-22, industrial production recovered from the Covid pandemic and registered a double-digit growth of 11.4%. Industrial production further expanded by 5.2% in FY 2022-23.
- Initiatives like 'Make in India' have created a favourable business environment, encouraging investment and indigenous manufacturing.
- Production-linked incentives (PLIs) are boosting various sectors and aiming to make India competitive globally.
- The combined Index of Eight Core Industries increased by 12.1% (provisional) in October 2023 as compared to the Index of October 2022.
- The production of all eight core industries (namely; Cement, Coal, Crude Oil, Electricity, Fertilizers, Natural Gas, Refinery Products and Steel) recorded positive growth in October 2023 over the corresponding month of 2022.
- As Industry 4.0 approaches, integrating technologies like artificial intelligence, robotics, and the Internet of Things into its manufacturing processes, is crucial, and requires a skilled and adaptable workforce.
UPSC Civil Services Examination, Previous Year Questions (PYQs)
Prelims
Q1. In the ‘Index of Eight Core Industries’, which one of the following is given the highest weight? (2015)
(a) Coal production
(b) Electricity generation
(c) Fertiliser production
(d) Steel production
Ans: (b)
Q2. With reference to Indian economy, consider the following statements: (2015)
- The rate of growth of Real Gross Domestic Product has steadily increased in the last decade.
- The Gross Domestic Product at market prices (in rupees) has steadily increased in the last decade.
Which of the statements given above is/are correct?
(a) 1 only
(b) 2 only
(c) Both 1 and 2
(d) Neither 1 nor 2
Ans: (b)
Mains
Q.1 “Industrial growth rate has lagged behind in the overall growth of Gross-Domestic-Product(GDP) in the post-reform period” Give reasons. How far are the recent changes in Industrial Policy capable of increasing the industrial growth rate? (2017)
Q.2 Normally countries shift from agriculture to industry and then later to services, but India shifted directly from agriculture to services. What are the reasons for the huge growth of services vis-a-vis the industry in the country? Can India become a developed country without a strong industrial base? (2014)


