Indian Economy
Multidimensional Poverty Index: Flaws and Solutions
- 08 Dec 2023
- 15 min read
This editorial is based on “Multidimensional Poverty Index reduction under the NDA is flawed” which was published in The Hindu on 07/12/2023. The article points out several methodological and conceptual problems with the MPI and the data sources used to compute it.
For Prelims: Amartya Sen’s capability approach, Human Development Index, United Nations Development Programme (UNDP), Multidimensional Poverty Index (MPI), National Sample Survey (NSS)
For Mains: Multidimensional Poverty Index: Issues and Way Forward
“Poverty is a great enemy to human happiness; it certainly destroys liberty, and it makes some virtues impracticable, and others extremely difficult.” - Samuel Johnson
In sharp contrast, conventional measures of poverty in terms of income are limited and narrowly focused on scarcity of resources to eke out a bare subsistence. But there is much more to poverty than a bare subsistence.
Nobel Laurate Amartya Sen pioneered a rich, innovative and broader perspective on well-being, focusing on capabilities and functionings popularly knowns as capability approach.
What is Amartya Sen's Capability Approach?
- Amartya Sen’s capability approach is a normative framework for evaluating individual well-being and social arrangements.
- It focuses on the real opportunities or freedoms that people have to achieve the kind of lives they value, rather than on their happiness, preferences, or resources.
- According to Sen, the capability approach has two main components: functionings and capabilities.
- Functionings are the valuable states of being and doing that a person can achieve, such as being healthy, educated, or socially active.
- Capabilities are the set of alternative functionings that a person can choose from, given their personal and social circumstances.
- For example, a person may have the capability to be either well-nourished or undernourished, depending on their access to food and their dietary choices.
- Sen argues that the capability approach is a better way of assessing human welfare than other approaches, such as utilitarianism and resourcism.
- He claims that these approaches are either too narrow or too insensitive to the diversity and complexity of human lives.
- Utilitarianism is about making choices that lead to the greatest happiness or satisfaction of desires.
- While resourcism is about how resources like income, wealth, or goods are distributed in society.
- For Sen, the ultimate goal of development is to expand people’s capabilities, not just their incomes or utilities.
- He claims that these approaches are either too narrow or too insensitive to the diversity and complexity of human lives.
- Sen’s capability approach has inspired the creation of the Human Development Index.
What is Human Development Index (HDI)?
- HDI is a composite index that combines three dimensions of human development: health, education and standard of living.
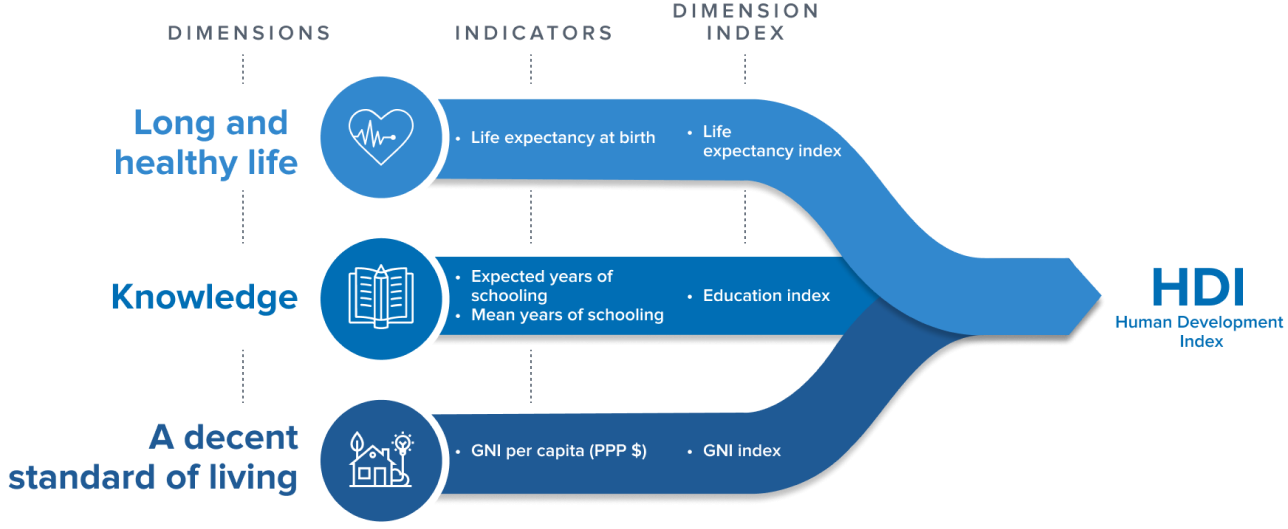
- It ranges from 0 to 1, with higher values indicating higher human development.
- HDI is calculated by the United Nations Development Programme (UNDP) and published annually in the Human Development Report.
- HDI alone could not capture the multiple dimensions and complexities of poverty, so to complement HDI, concept of Multidimensional Poverty Index (MPI) was introduced.
What is MPI and how is it different from HDI?
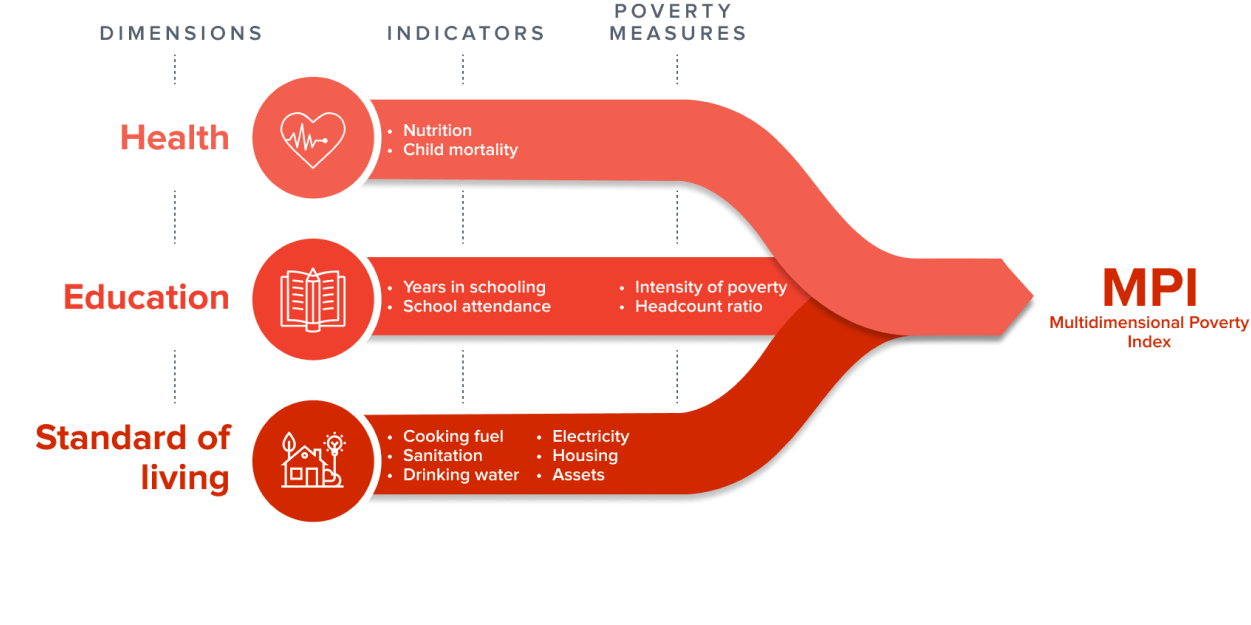
- The Multidimensional Poverty Index (MPI):
- The MPI is a measure of poverty that captures the multiple deprivations that people face across different dimensions such as health, education, and living standards.
- The MPI was developed by the Oxford Poverty and Human Development Initiative (OPHI) and the United Nations Development Programme (UNDP) and is published in the Human Development Reports.
- The MPI is calculated by multiplying the percentage of people who are multidimensionally poor (the incidence or headcount ratio) by the average number of dimensions in which they are deprived (the intensity).
- The MPI ranges from 0 to 1, with higher values indicating higher levels of multidimensional poverty.
- MPI vs HDI:
| MPI | HDI |
| Measures the deprivations of individuals in three dimensions: health, education, and standard of living | Measures the achievements of countries in three dimensions: life expectancy, education, and income per capita |
| Uses 10 indicators to capture the intensity and incidence of poverty | Uses three indicators to capture the average level of human development |
| Ranges from 0 to 1, where 0 means no poverty and 1 means extreme poverty | Ranges from 0 to 1, where 0 means low human development and 1 means very high human development |
| Published annually by the United Nations Development Programme (UNDP) and the Oxford Poverty and Human Development Initiative (OPHI) | Published annually by the United Nations Development Programme (UNDP) |
Acknowledge this as well
- The MPI can identify who is poor and how they are poor, by showing the number and percentage of people who are multidimensionally poor, and the average number of deprivations they face.
- The MPI can also be disaggregated by regions, ethnic groups, or other categories, to reveal inequalities and patterns of poverty within countries.
Who calculates the MPI in India?
- The MPI in India is calculated by the NITI Aayog in collaboration with the Oxford Poverty and Human Development Initiative (OPHI) and the United Nations Development Programme (UNDP).
- The NITI Aayog is the nodal agency for the National MPI, ranking States and UTs based on their performance.
- The primary data source to arrive at these figures was National Family Health Survey-5 (NFHS-5).
Why is MPI 2023 data being Questioned?
- Rapid Reduction in MPI Values: The validity of the reported decrease in India's national MPI 2023 value from 24.85% to 14.96% between 2015-16 and 2019-21 is being questioned for its validity. The reduction of 9.89% suggests a substantial improvement in poverty levels, indicating that about 135.5 million people have exited poverty during this period. However, these estimates are considered misleading and ill-informed.
- Ignoring the Impact of COVID-19 Pandemic: The drastic reduction in MPI values does not account for the economic and social disruptions caused by the Covid-19 pandemic in 2020-21.
- The economic shock and the subsequent struggles of the Indian economy are not adequately considered in the MPI estimates, raising questions about the accuracy of the reported improvements in poverty levels.
What are the Issues related to Calculation of MPI in India?
- Aggregation with Uniform Weighting: The methodology used in the MPI, similar to the UNDP Human Development Index, involves aggregation with uniform weighting. This means that all dimensions are given equal importance in calculating the overall index. This approach can oversimplify the complexities of poverty by not accounting for the varying significance of different deprivations.
- The national MPI uses the same weights and cut-offs for all the indicators across the states and districts, which may not reflect the diversity and heterogeneity of the country.
- For example, the deprivation cut-off for electricity is having access to electricity for at least four hours a day, which may not be adequate for some regions or sectors.
- The national MPI uses the same weights and cut-offs for all the indicators across the states and districts, which may not reflect the diversity and heterogeneity of the country.
- Data Source Issues: The MPI relies on data from the National Family Health Surveys (NFHS) 4 and 5. The critics argue that these surveys are not detailed enough for accurate estimation, and there are concerns about the reliability of NFHS 5 due to its alleged contradiction with official claims regarding open defecation. Despite these issues, the MPI uses the NFHS data without addressing the limitations adequately.
- NFHS is conducted every five years which means that the MPI may not capture the latest changes in the poverty situation in the country.
- Omission of Relevant Data Sources: The MPI does not incorporate data from the 75th Round of the National Sample Survey (NSS) on household consumption expenditure.
- Combining NFHS data with NSS data could provide a more comprehensive and accurate picture of multidimensional poverty. However, this relevant data source is excluded from the estimation process.
- Missing Dimensions: The national MPI does not include some important dimensions of poverty, such as social exclusion, discrimination, violence, insecurity, and environmental degradation, which may affect the quality of life of the poor.
- Moreover, some of the indicators, such as nutrition and education, may not capture the multidimensional aspects of these dimensions, such as the quality of food and learning outcomes.
- Intra-household Differences: The national MPI may not be able to capture the intra-household differences in poverty, especially the gender and age disparities, as it uses the household as the unit of analysis.
- This may mask the variations in the deprivations faced by different members of the household, such as women, children, elderly, and persons with disabilities.
What Measures should be taken to Improve MPI?
- Adjustment for Income Fluctuations: Given the drastic decrease in State per capita income leading to a spike in MPI, consider implementing a mechanism to account for income fluctuations. This could involve smoothing techniques or incorporating a lagged income variable to capture the economic effects over time.
- Dynamic Urban-Rural Migration Impact: Acknowledge the impact of dynamic factors on urban locations, especially considering the reverse migration during the Covid-19 pandemic. Develop a model that reflects the changing patterns of rural-urban migration and its effects on living conditions and MPI.
- Emphasize Expenditure on Education: Both health care and education expenditure are associated with lower MPI — the elasticity of the education is higher (in absolute value), implying that a 1% increase in the education reduces MPI more than the same increase in the health care. As State-level estimates suggest a decline in educational expenditure, a rise in MPI is likely.
- Criminal MPs Impact Mitigation: Given the correlation between the share of MPs with criminal cases and higher MPI, explore strategies to mitigate this impact. This could involve policy initiatives to curb corruption, enhance transparency, and address the challenges posed by criminal elements within legislative bodies.
- As per a study, if the share of Members of Parliament with criminal cases in total State MPs exceeded 20%, the higher was the MPI.
- Sensitivity Analysis: Conduct sensitivity analyses to test the robustness of the MPI model. This involves varying key parameters to understand how changes in inputs impact the results, providing insights into the stability and reliability of the MPI calculations.
- Policy Recommendations: Use the findings to inform policy recommendations aimed at addressing the identified drivers of poverty. This could involve advocating for policies that promote income stability, targeted investments in education and healthcare, and measures to combat corruption and criminality in legislative bodies.
|
Drishti Mains Question: Compare and contrast between multidimensional poverty index and human development index (HDI). Also, discuss the challenges in MPI calculation in India and suggest some measures to improve MPI calculation. |
UPSC Civil Services Examination, Previous Year Question (PYQ)
Prelims
Q. The Multi-dimensional Poverty Index developed by Oxford Poverty and Human Development Initiative with UNDP support covers which of the following? (2012)
- Deprivation of education, health, assets and services at household level
- Purchasing power parity at national level
- Extent of budget deficit and GDP growth rate at national level
Select the correct answer using the codes given below:
(a) 1 only
(b) 2 and 3 only
(c) 1 and 3 only
(d) 1, 2 and 3
Ans: (a)
Mains
Q. Despite Consistent experience of high growth, India still goes with the lowest indicators of human development. Examine the issues that make balanced and inclusive development elusive. (2019)
Q. Professor Amartya Sen has advocated important reforms in the realms of primary education and primary health care. What are your suggestions to improve their status and performance? (2016)


