Indian Economy
Cost Dynamics of Electricity Production
- 16 Oct 2019
- 7 min read
The editorial is based on the article “A cost-effective way to power generation” which appeared in The Hindu on 16 October 2019. The article is based on various aspects of declining cost of power generation in the country, especially renewable energy.
Recently, Indian Prime Minister while addressing 74th session of United Nation General Assembly strongly focused on increasing global renewable energy capacity.
In the past few years, India has been aggressively expanding its power generation capacity. India has an installed capacity of 358 GW, which is four times of what it was in 1997-98.
- India’s per-capita energy consumption is about one-third of the global average. Though India accounts for around 18% of the world’s population, it uses only around 6% of the world’s primary energy.
- India’s per capita energy consumption equals 0.6 tonnes of oil equivalent (toe) as compared to the global per capita average of 1.8 toe.
India’s Energy Installation Bag
| Source | Installed Capacity (March 2019) | Percentage of Total Installed Capacity |
| Thermal Energy | 200.7 GW |
56% |
| Hydel Energy | 45.39 GW | 13% |
| Solar Energy | 28.18 | 7.9% |
| Wind Energy | 35.63 | 10% |
| Nuclear Energy | 6.7 GW | 2% |
India’s Energy Targets
Under the Paris Agreement, India has declared its INDC target of about 40% cumulative electric power installed capacity from non-fossil fuel based energy resources by 2030. India embarks on an ambitious journey to achieve renewable energy capacity of 175 GW by 2022 and 500 GW by 2030. By 2022, India plans to achieve the following renewable energy targets:
- Solar Energy: 100 GW
- Wind Energy: 60 GW
- Biomass Energy: 10 GW
It also plans to have 15 GW of nuclear energy and 72 GW of hydel energy by 2027.
Major Factor that Determine Cost in Power Generation
Fixed Cost
- Land: Land forms the major part of fixed investment in power generation which regionally varies and depends on government and pooling policies.
- Building and Construction Cost of Power Station: The capital cost of building central station generators vary from region to region, largely as a function of labor costs and "regulatory costs," which include things like obtaining siting permits, environmental approvals, and so on.
- Transmission and Distribution System: The electricity transmission and distribution systems that deliver electricity have maintenance costs, which include repairing damage to the systems from accidents or extreme weather conditions.
Varying Cost
- Fuel: Fuel costs can vary, especially during periods of high demand. High electricity demand can increase demand for fuel, such as natural gas, which can result in higher prices for the fuel and, in turn, higher costs to generate electricity.
- Regulations: In some states, public service/utility commissions fully regulate prices, while other states have a combination of unregulated prices (for generators) and regulated prices (for transmission and distribution).
- Weather conditions: Rain and snow provide water for low-cost hydropower generation. Wind can provide low-cost electricity generation from wind turbines when wind speeds are favorable. However, extreme temperatures can increase the demand for electricity, especially for cooling, and demand can drive prices up.
Reasons for Declining Cost of Energy
- Advances in technology have resulted in the construction of larger power plants, indicating economies of scale.
- Increasing share of private sector investment which is far more cost effective than public investment.
- Competitive tariff-based bidding of solar project that Solar Energy Corporation of India, State and Central Government have undertaken through reverse auctioning.
- The subsidies and incentives provided by the Government under National Solar Mission have been instrumental in reducing cost and adoption of solar energy.
- Historically, land acquisition has always been a problem in India and is a major reason for cost escalation in infrastructure projects.
- The Solar Park Policy introduced guidelines that lead state governments to identify suitable large tracts of land with appropriate insolation levels, and prioritise the use of government waste/non-agricultural land in order to speed up acquisition process for setting up solar park.
What next can be done to reduce the cost further?
- Project Size and Cost
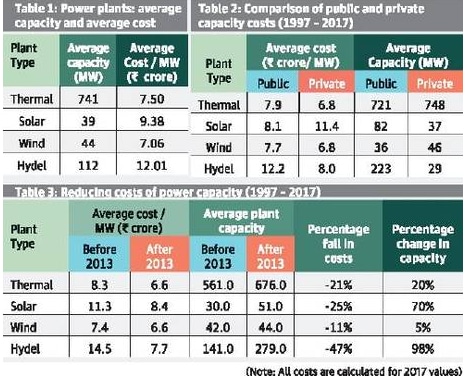
- Infrastructure projects have an inverse relationship between size and unit cost. The average cost per MW for a thermal plant is about 25% lower than that of a solar plant. Thermal plants are of huge capacity and on average it would take 18 solar or wind plants to generate the same quantity of power as one thermal plant. Therefore, large solar and wind plants are to be constructed in the future to shift toward non-fossilized clean energy.
- Project Ownership
- Over the last two decades, 63% of the total planned generation capacity has come from the private sector, and investment were more pronounced in solar and wind energy sector.
- Private sector plants have an average cost of 12-34% lower cost per MW for all categories except solar. Therefore, creating additional capacity in existing plant at lower cost can play a big role in keeping electricity tariffs low.
Way Forward
- As India continues to ramp up capacity, it is imperative to create generation assets with the lowest unit cost by optimizing plant capacities and encouraging private sector investment.
| Drishti Inputs Briefly outline the underlying causes for declining cost of electricity production in recent times. Also suggest policy measures to reduce the cost further. |


