Indian Economy
Gist of Economic Survey 2022-23
- 01 May 2023
- 146 min read
01. State of the Economy 2022-23: Recovery Complete
At least three shocks have hit the global economy since 2020: COVID-19, Russia-Ukraine conflict, and policy rate hikes.
Key Points
- It all started with the pandemic-induced contraction of the global output, followed by the Russian-Ukraine conflict leading to a worldwide surge in inflation. Then, the central banks across economies led by the Federal Reserve responded with synchronised policy rate hikes to curb inflation.
- After the three major shocks to the global economy since 2020, India appears to have moved on. Indian economy is projected to be the fastest-growing major economy in FY23 at a 6.5-7.0% growth rate, as per various agencies worldwide.
- India staged a full-recovery in FY22 while ahead of many nations and positioning itself to ascend to the pre-pandemic growth path in FY23. India’s economic growth in FY23 has been principally led by two main reasons: private consumption and capital formation.
Challenges to the global economy
- The third decade of the twenty-first century witnessed various challenges that hit global growth; causing inflation, disrupting the restoration of the supply chains, a hardening of bond yields, and soaring prices of essential commodities among others.
- The COVID-19 pandemic notified by the World Health Organisation (WHO) in January 2020 was the first major challenge that caused growth to weaken.
- The Russia-Ukraine conflict that broke out in February 2022, caused the world economy to face almost as many disruptions (in the last 11 months), as it faced in the two-year timespan of COVID-19.
- Monetary tightening policy posed the third major challenge, where the pace of the monetary tightening cycle has been rapid. Central banks have been hiking policy rates and rolling back liquidity to rein in inflation synchronously.
| Global economic growth forecast across countries | ||||
| Growth Projections (%) | Change from WEO Update (July 2022) (%) | |||
| 2022 | 2023 | 2022 | 2023 | |
| World | 3.2 | 2.7 | 0 | –0.2 |
| Advanced Economies | 2.4 | 1.1 | –0.1 | –0.3 |
| United States | 1.6 | 1 | –0.7 | 0 |
| Euro Area | 3.1 | 0.5 | 0.5 | –0.7 |
| UK | 3.6 | 0.3 | 0.4 | –0.2 |
| Japan | 1.7 | 1.6 | 0 | –0.1 |
| Emerging Market Economies | 3.7 | 3.7 | 0.1 | –0.2 |
| China | 3.2 | 4.4 | –0.1 | –0.2 |
| India* | 6.8 | 6.1 | –0.6 | 0 |
| Source: IMF | ||||
| Note: *Projection for India is for its fiscal year (Apr-Mar), while for the other economies, it is from Jan-Dec. | ||||
Macroeconomic and Growth Challenges in the Indian Economy
- India’s retail inflation was above the RBI’s tolerance range of 6% for about 10 months from January to November 2022.
- The US dollar has appreciated against the Indian rupee due to the monetary tightening policy of the Federal Reserve, and this may have added to the domestic inflationary pressures besides widening the Current Account Deficit (CAD).
- The government cut excise and customs duties and restricted exports to restrain inflation while the RBI, like other central banks, raised the repo-rates and rolled back excess liquidity.
India’s Economic Resilience and Growth Drivers
- IMF estimates India to be one of the top two fast-growing significant economies in 2022, this is a reflection of India’s underlying economic resilience; of its ability to recoup, renew and re-energise the growth drivers of the economy.
- Exports, manufacturing, and investment activities consequently gained traction in FY22 & FY23.
- Private Consumption as a percentage of GDP stood at 58.4% in Q2 of FY23, the highest among the second quarters of all the years since 2013-14, thereby contributing to a rise in domestic capacity utilisation.
- The rebound in consumption has also been supported by the release of “pent-up” demand, a phenomenon influenced by a rise in the share of consumption in disposable income.
- The economic output of the country is set to increase by at least four times the amount of Capex (Capital Expenditure), as per the Capex multiplier estimations.
- A capex thrust in the last two budgets of the Government of India was meant to address the infrastructure gaps, crowding-in private investment into an economic landscape broadened by the vacation of non-strategic PSEs (disinvestment), and idling public sector assets.
- The credit growth to the MSME sector has been remarkably high, over 30.5% on average, during Jan-Nov 2022, supported by the extended Emergency Credit Line Guarantee Scheme (ECLGS) of the central government.
India’s Inclusive Growth
- India is the 3rd largest economy in the world in PPP terms and the 5th largest in market exchange rates.
- The urban unemployment rate for people aged 15 years and above declined from 9.8% to 7.2% in one year (from September 2021 to September 2022), as per the Periodic Labour Force Survey (PLFS).
- The Emergency Credit Line Guarantee Scheme (ECLGS) has succeeded in shielding micro, small, and medium enterprises (MSMEs) from financial distress.
- The Mahatma Gandhi National Rural Employment Guarantee Act (MGNREGA), besides generating daily wage employment, has also been creating assets for individual households to diversify their sources of income and lift their supplementary incomes.
- Schemes like PM-KISAN, which benefits households covering half the rural population, and PM Garib Kalyan Anna Yojana have significantly contributed to lessening impoverishment in the country.
Outlook: 2023-24
- India’s recovery from the pandemic was relatively quick, and growth in the upcoming year will be supported by solid domestic demand and a pickup in capital investment.
- Strong domestic demand amidst high commodity prices will raise India’s total import bill and contribute to unfavorable developments in the current account balance. These may be exacerbated by plateauing export growth on account of slackening global demand.
- Structural reforms such as the introduction of the Goods and Services Tax (GST) and the Insolvency and Bankruptcy Code (IBC) enhanced the efficiency and transparency of the economy and ensured financial discipline and better compliance.
- The real GDP growth will probably lie in the range of 6.0-6.8%, depending on the trajectory of economic and political developments globally.
02. India's Medium-Term Growth Outlook: With Optimism and Hope
- In the present decade, the presence of strong medium-term growth magnets gives us optimism and hope that once these global shocks of the pandemic and the spike in commodity prices in 2022 fade away, the Indian economy is well placed to grow faster in the coming decade.
Key Points
- With the impetus of the persistent structural and governance reforms introduced in the country and strong macroeconomic stability, it is essential to get a handle on the medium-term growth outlook for India.
- The reforms undertaken before 2014 primarily catered to product and capital market space and they were necessary as well, therefore continued post-2014.
- The government, however, imparted a new dimension to these reforms in the last eight years. With an underlying emphasis on enhancing the ease of living and doing business and improving economic efficiency, the reforms are well placed to lift the economy’s potential growth.
- The emphasis of the government’s approach is on building partnerships amongst various stakeholders in the development process, where each contributes to and reaps the development benefits.
Reforms for New India
- Creating public goods to enhance opportunities, efficiencies, and ease of living
- The dedicated programs for road connectivity (Bharatmala), port infrastructure (Sagarmala), electrification, railways upgradation, and operationalizing new airports/air routes (UDAN) have significantly improved the physical infrastructure in the last few years.
- Besides the push to physical infrastructure, the government’s emphasis on developing public digital infrastructure during the last few years has been a game changer in enhancing the economic potential of individuals and businesses.
- Trust-based governance
- Simplification of regulatory frameworks through reforms such as the Insolvency and Bankruptcy Code (IBC) and the Real Estate (Regulation and Development) Act (RERA) have enhanced the ease of doing business.
- The IBC has imbibed some of the best international practices of an asset resolution mechanism. It provides an honourable exit mechanism for honest business failures and enables the release of credit locked into the stressed assets for better resource allocation.
- The RERA has transformed the real estate sector by registering real estate brokers and agents with the regulator, establishing mechanisms for the speedy redressal of disputes and enabling a single window clearance for timely approvals to the developers.
- Another significant reform to enhance doing business has been the decriminalization of minor economic offences under the Companies Act of 2013. It introduced civil liabilities for dealing with simple defaults that do not involve fraud or where the nature of the lapse is purely procedural.
- The buoyancy of the indirect tax system replaced by GST has improved in the post-GST regime, and the positive GST revenue collection trends have strengthened further despite the pandemic.
- Enhancing productivity in agriculture
- Policies such as Soil Health Cards, the Micro irrigation Fund, and organic and natural farming have helped farmers optimize resource use and reduce the cultivation cost.
- The promotion of Farmer Producer Organizations (FPOs) and the National Agriculture Market (e-NAM) extension Platform have empowered farmers, enhanced their resources, and enabled them to get good returns.
Growth Magnets in this Decade (2023-2030)
- As the health and economic shocks of the pandemic and the spike in commodity prices in 2022 wear off, the Indian economy is thus well placed to grow at its potential in the coming decade.
- The sound and healthy financial system developed over the last few years will ensure efficient credit provisioning, contributing to higher growth in the coming years through higher investments and consumption.
- Thanks to India’s digital revolution and formalization, banks have far more information about their customer’s credit risks than before, thus being able to make credit and pricing decisions better than before.
- The evolving geo-political situation also presents an opportunity for India to benefit from the diversification of global supply chains. With enabling policy frameworks, India presents itself as a credible destination for capital diversifying out of other countries.
03. Fiscal Developments: Revenue Relish
- With the continuing global risks and uncertainties, the availability of fiscal space with governments has become paramount. It is especially true following the recent incidence of the pandemic when the fiscal policy became an effective macroeconomic stabilisation tool globally.
Key Points
- The Union Budget for FY23 was presented in an uncertain macroeconomic environment. Soon after its presentation, the geopolitical conflict aggravated global supply disruptions and adversely impacted the prices of fuel, food, and other essential commodities.
- The Government of India's fiscal policy response to the crisis comprised of a judicious mix of increasing food and fertiliser subsidies on the one hand and a reduction in taxes on fuel and certain imported products on the other.
- Despite the additional fiscal pressures during the year, the Union Government is on track to achieve the budget estimate (BE) for the fiscal deficit in FY23.
- The Gross Tax Revenue registered a Year-on-Year (YoY) growth of 15.5% from April to November 2022, driven by robust growth in the direct taxes and Goods and Services Tax (GST).
- The GST has stabilised as a vital revenue source for central and state governments, with the gross GST collections increasing at 24.8% on YoY basis.
- The Centre's Capex has steadily increased from a long-term average of 1.7% of GDP (FY09 to FY20) to 2.5% of GDP in FY22 PA.
Developments in Union Government Finances
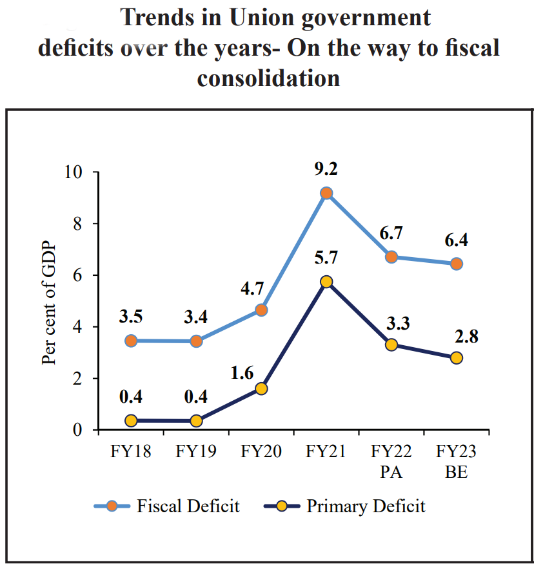
- The fiscal deficit of the Union Government, which reached 9.2% of GDP during the pandemic year FY21, has moderated to 6.7% of GDP in FY22 and is further budgeted to reach 6.4% of GDP in FY23.
- The fiscal deficit of the Union Government at the end of November 2022 stood at 58.9% of the BE, lower than the five-year moving average of 104.6% of BE during the same period.
- This resilience in the fiscal performance of the Centre has resulted due to a recovery in economic activity, buoyancy in revenues observed during the year, and conservative assumptions of macroeconomic variables in the Budget.
- Sustained revenue buoyancy
- Revenue receipts registered robust growth in FY22, this revival was attributed to a rebound in the collection of all major direct and indirect taxes (except excise duties) in FY22.
- Tax administration/policy measures, such as the Faceless Assessment and Appeal, simplification of return filing, generation of e-way bills under the GST system, information sharing between government departments, etc., have nudged higher tax compliance through technology and artificial intelligence.
- Direct taxes propelling the growth in gross tax revenue
- Direct taxes, which broadly constitute half of the Gross Tax Revenue, have registered a YoY growth of 26% from April to November 2022, enabled by corporate and personal income tax growth.
- The growth rates observed in the major direct taxes during the first eight months of FY23 were much higher than their corresponding longer-term averages.
- Customs and Excise duties as Flexi-fiscal policy tools
- While direct taxes have safeguarded the revenue buoyancy, indirect taxes such as customs and excise duties have acted as flexible policy tools during the fiscal response to the pandemic.
- Given the rise in prices of essential imported products during FY23, customs duties were brought down on several items to control the inflation impact on edible oils, pulses, cotton, steel, etc.
- High imports during the current year have led to a 12.4% YoY growth in the customs collection from April to November 2022, which is higher than the average growth during the corresponding period from FY13 to FY19.
- Stabilizing Goods and Services Tax yielding returns
- GST taxpayers increased from nearly 70 lakhs in 2017 to more than 1.4 crore in 2022.
- The improvement in GST collections has been due to the combined effect of the rapid economic recovery post-pandemic and the nationwide drive against GST evaders.
- These were coupled with many systemic changes introduced recently, and various rate rationalization measures undertaken by the GST Council to correct inverted duty structure.
- Committed towards disinvestment but dependent on external factors
- During FY15 to FY23, an amount of about Rs. 4.07 lakh crore has been realized as proceeds from disinvestment through 154 transactions using various modes/instruments.
- The government has reaffirmed its commitment towards privatization and strategic disinvestment of Public Sector Enterprises by implementing the New Public Sector Enterprise Policy and Asset Monetization Strategy.
- Out of the budgeted amount of Rs. 65,000 crore for FY23, 48% has been collected through disinvestment (as of January 2023).
- Pragmatic expenditure policy of re-prioritization
- In FY22, the total Union Government expenditure was brought down to 16% of GDP, and a more significant proportion of this accrued to capital expenditure.
- The capital expenditure by the Centre has steadily increased from a long-term average of 1.7% of GDP (FY09 to FY20) to 2.5% of GDP in FY22 and is further budgeted to increase to 2.9% of GDP in FY23.
- While on the one hand, capital expenditure strengthens aggregate demand and crowds-in private spending in times of risk aversion; it also enhances the longer-term supply-side productive capacity.
- Capex-led growth to bring back animal spirits and manage debt levels
- The Government's thrust on Capital expenditure, particularly in the infrastructure-intensive sectors like roads and highways, railways, and housing and urban affairs, has longer-term implications for growth.
- While on the one hand, capital expenditure strengthens aggregate demand and crowds-in private spending in times of risk aversion; it also enhances the longer-term supply-side productive capacity.
- To push for enhancing Capex from all directions, the Centre announced several incentives to boost states' capital expenditure in the form of long-term interest-free loans and capex-linked additional borrowing provisions.
- Geopolitical developments stretched the Revenue Expenditure requirements
- Due to the sudden outbreak of geopolitical conflict resulting in higher international prices for food, fertiliser and fuel, there was a higher food and fertiliser subsidy requirement for supporting the people and ensuring macroeconomic stability.
- Higher resource requirements and lower revenue collections during the pandemic resulted in higher borrowings by the Union Government. Interest payments as a proportion of receipts went up after the pandemic outbreak.
- However, in the medium term, as we move along the fiscal glide path, buoyancy in revenues, aggressive asset monetisation, efficiency gains, and privatisation would help pay down the public debt, thus bringing down interest payments and releasing more monies for other priorities.
Overview of State Government Finances
- Performance of State finances
- The combined Gross Fiscal Deficit (GFD) of the States, which increased to 4.1% of GDP in the pandemic-affected year, was brought down to 2.8% in FY22, and the consolidated GFD-GDP ratio for States has been budgeted 3.4% in FY23.
- The Centre enhanced the net borrowing ceilings (NBC) for States to 5% of GSDP in FY21, 4% of GSDP in FY22, and 3.5% of GSDP in FY23.
- The States' combined own tax revenue and own non-tax revenue was anticipated to grow at 17.5% and 25.6% over FY22 RE (Revised Estimates), and revenue & capital expenditures in FY22 BE (Budget Estimates) were envisaged to grow at 10.4% and 16%, respectively.
- Cooperative fiscal federalism
- Total transfers to States have risen between FY19 and FY23 BE.
- The Finance Commission had recommended allocation of Rs. 1.92 lakh crore for FY23 in respect of post-devolution revenue deficit grants, grants to local bodies, health sector grants, and disaster management grants.
- To meet the shortfall in GST compensation for States, the Government, in addition to the release of regular GST compensation from the Fund, borrowed Rs. 2.69 lakh crore during FY21 and FY22 and passed it on to States on a back-to-back basis.
| Details of transfers from Centre to States (other than devolution to States) | |||||
| FY19 | FY20 | FY21 | FY22.RE | FY23.BE | |
| (in Rs. lakh crore) | |||||
| Centrally Sponsored Schemes | 3.0 | 3.1 | 3.8 | 4.2 | 4.4 |
| Finance Commission Grants | 0.9 | 1.2 | 1.8 | 2.1 | 1.9 |
| Other Grants/Loans/ Transfers | 0.9 | 2.0 | 1.9 | 2.3 | 3.0 |
| Source: Union budget documents | |||||
- Supporting the GST compensation payments during crisis
- Recognising the importance of a well-targeted fiscal policy by national and sub-national governments, the Union Government has taken consistent steps to support the state finances and incentivise States to move forward on the reforms agenda.
- To meet the shortfall in GST compensation for States, the Government, in addition to the release of regular GST compensation from the Fund, borrowed Rs. 2.69 lakh crore during FY21 and FY22 and passed it on to States on a back-to-back basis.
- Moreover, the cess payments and tax devolution instalments to the States were frontloaded to give them early access to funds.
- Enhanced limit of borrowing for the States and incentives for reforms
- Since the pandemic outbreak, the Centre has kept the Net borrowing Ceiling of the State Governments above the Fiscal Responsibility Legislation (FRL) threshold. It was fixed at 5% of GSDP in FY21, 4% of GSDP in FY22 and 3.5% of GSDP in FY23.
- A part of this additional borrowing was linked to reforms encouraging the States to undertake them. For instance, in FY21, a part of the additional borrowing ceiling was conditional on implementing the 'One Nation One Ration Card' System, urban local body/utility reforms, and power sector reforms.
- In addition to the net borrowing ceilings fixed for the States, Fifteenth Finance Commission had recommended performance-based additional borrowing space of 0.50% of Gross State Domestic Product (GSDP) to the States in the power sector.
Debt Profile of the Government
- Given the unprecedented fiscal expansion in 2020, rising government liabilities have emerged as a significant concern across the globe. IMF projects the global government debt at 91% of GDP in 2022, about 7.5 percentage points above the pre-pandemic levels.
- While countries worldwide had started winding up the fiscal support provided during the pandemic, challenging global financial conditions amidst global uncertainties tightened budget constraints. All these factors, together with rising interest rates and the fear of slower growth, make the sustainability of sovereign debts a concern worldwide.
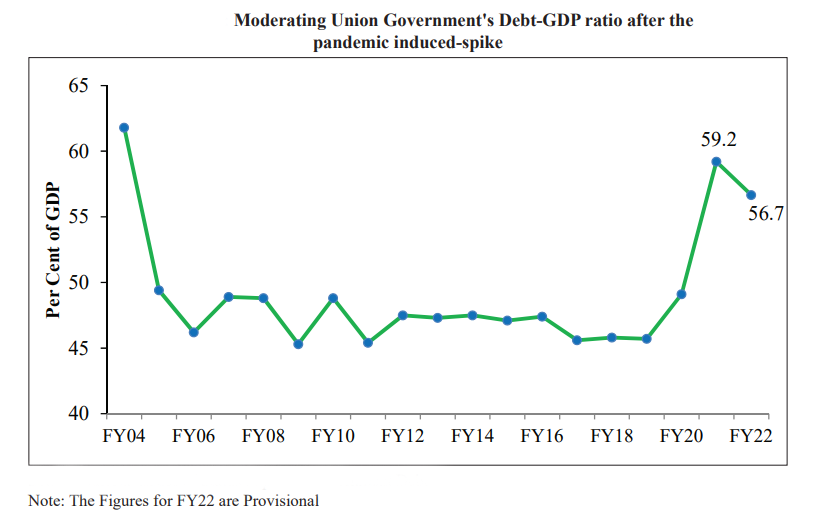
- For India, the total liabilities of the Union Government, which were relatively stable as a percentage of GDP over the past decade, witnessed a sharp spike in the pandemic year FY21. Total liabilities of the Union Government moderated from 59.2% of GDP in FY21 to 56.7% in FY22.
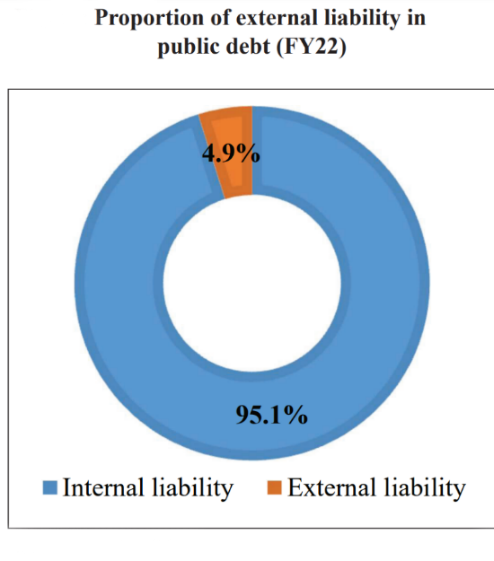
- India's public debt profile is relatively stable and is characterised by low currency and interest rate risks. Of the Union Government's total net liabilities in end-March 2021, 95.1% were denominated in domestic currency, while sovereign external debt constituted 4.9%, implying low currency risk. Further, sovereign external debt is entirely from official sources, which insulates it from volatility in the international capital markets.
- Public debt in India is primarily contracted at fixed interest rates, with floating internal debt constituting only 1.7% of GDP in end-March 2021. The debt portfolio is, therefore, insulated from interest rate volatility, which also provides stability to interest payments.
- The weighted average maturity of the outstanding stock of dated securities of the government has increased from 9.7 years in end-March 2010 to 11.71 years in end-March 2022, thus reducing the rollover risk in the medium-term. Over the last few years, the proportion of dated securities maturing in less than five years has declined, whereas long-term securities have shown an increasing trend.
Conclusion
The Government of India has adopted a holistic policy towards fiscal stability in the last few years. As India's economic recovery advances, amidst the continuing global uncertainties and risks, the fiscal glide path illuminates the path for fiscal policy. That will ensure more significant fiscal space for policy action in uncertain times. Further, in reality, fiscal discipline translates into a fiscal stimulus for all sections of the economy through lower interest rates.
04. Monetary Management and Financial Intermediation: A Good Year
The RBI initiated its monetary tightening cycle in April 2022 and has since implemented a policy repo rate hike of 225 bps. Consequently, domestic financial conditions began to tighten, which was reflected in the lower growth of monetary aggregates.
Monetary Developments
- The Monetary Policy Committee (MPC) maintained a status quo on the policy repo rate between May 2020 and February 2022 after implementing a 115 basis points (bps) reduction between March 2020 and May 2020.
- Retail inflation crossed the upper limit of RBI’s tolerance band since January 2022. Sensing a serious risk to price stability, RBI initiated the monetary tightening cycle.
- In its April 2022 meeting, the MPC introduced the Standing Deposit Facility (SDF), which allowed for the deposit of excess funds by banks with the RBI without the necessity of collateral in the form of government securities, thereby allowing effective liquidity management in a collateral-free manner.
- The SDF, introduced at a rate of 3.75 per cent, replaced the reverse repo rate as the new floor of the Liquidity Adjustment Facility (LAF) corridor.
- Reserve money (M0) increased by 10.3 per cent year-on-year (YoY) as on 30th December 2022 compared to 13 per cent last year. So far, expansion in M0 during FY23 was mainly driven by bankers’ deposits with the RBI, with an increase in the CRR.
- As on 30th December 2022, broad money stock (M3) increased by 8.7 per cent YoY. Amongst sources, bank credit to the commercial sector drove the expansion of broad money, and net bank credit to the government supplemented this expansion.
- The money multiplier – the ratio of M3 and M0 – has broadly remained stable at an average of 5.1 over April – December 2022 period compared to 5.2 in the corresponding period of the previous year.
| Monetary Aggregates | |
| Aggregate | Components |
| Reserve Money (M0) | Currency in Circulation (CiC) |
| Bankers’ Deposits with the RBI | |
| Narrow Money (M1) | ------ |
| Broad Money (M3) | Currency with the Public |
| Demand and Time Deposits | |
Liquidity Conditions
- Surplus liquidity conditions that prevailed post-COVID-19 in response to the Reserve Bank’s conventional and unconventional monetary measures moderated during FY23.
- The RBI’s move to hike the Cash Reserve Ratio (CRR) by 50 bps resulted in a withdrawal of primary liquidity to the tune of Rs. 87,000 crore from the banking system.
- The gradual withdrawal of surplus liquidity pushed the weighted average call rate (WACR) – the operating target of monetary policy – closer to the policy repo rate, on an average basis.
- Interest rates on various money market rates – 91-day Treasury Bills (T-Bills), 3-month certificates of deposit and commercial papers – gradually firmed up in line with the increase in the repo rate.
Monetary Policy Transmission
- Lending and deposit rates of banks increased during FY23 in consonance with the policy repo rate changes.
- During FY23 (up to December 2022), external benchmark-based lending rate and 1-year median marginal cost of funds-based lending rate (MCLR) increased by 225 bps and 115 bps, respectively.
Developments in the G-sec Market
- After remaining steady through 2020 and 2021, the yield on the 10-year government bond rose in 2022. The weighted average yield spike reflects the domestic bond market volatility stemming from uncertainty in crude prices, a hawkish stance of major central banks, a hardening of global bond yield and the pressure on the rupee.
- The trading volume in G-Secs (including T-Bills and SDLs) reached a two-year high of Rs. 27.7 lakh crore during Q2 FY23, registering a YoY growth of 6.3 per cent. The higher trading volume reflects the growing interest of market players/ traders in the government security market.
Banking Sector
- RBI and the government have made dedicated efforts in implementation of 4R’s approach of Recognition, Resolution, Recapitalisation and Reforms to clean and strengthen the balance sheet of the banking system.
- The GNPA ratio has decreased from 8.2 per cent in March 2020 to a seven year low of 5.0 per cent in September 2022, while Net Non-Performing Assets (NNPA) have dropped to a ten-year low of 1.3 per cent of total assets.
- Lower slippages and the reduction in outstanding GNPAs through recoveries, upgrades and write-offs led to this decrease.
- There was a broad-based improvement in the GNPA ratio in the industrial sector, though it remained elevated for gems and jewellery and construction sub-sectors.
- Moreover, with shrinking GNPAs, the Provisioning Coverage Ratio (PCR) has been increasing steadily since March 2021 and reached 71.6 per cent in September 2022.
- Credit growth has been broad-based across sectors, with retail credit driving the growth primarily owing to rising demand for home loans.
- The recovery in economic activity in FY22, along with the enhanced financial soundness of banks and corporates, has bolstered the expansion of non-food bank credit since June 2021. The YoY growth in non-food bank credit accelerated to 15.3 per cent in December 2022.
Non-Banking Financial Companies (NBFCs)
- The growing importance of the NBFC sector in the Indian financial system is reflected in the consistent rise of NBFCs’ credit as a proportion to GDP as well as in relation to credit extended by SCBs.
- Credit extended by NBFCs is picking up momentum, with the aggregate outstanding amount at Rs. 31.5 lakh crore as of September 2022. NBFCs continued to deploy the largest quantum of credit from their balance sheets to the industrial sector, followed by retail, services, and agriculture.
- The continuous improvement in asset quality is seen in the declining GNPA ratio of NBFCs from the peak of 7.2 per cent recorded during the second wave of the pandemic (June 2021) to 5.9 per cent in September 2022, reaching close to the pre-pandemic level.
- With the decline in GNPAs, the capital position of NBFCs also remains robust, with a CRAR of 27.4 per cent in end-September 2022, slightly lower than 27.6 per cent in March 2022.
Progress made under the Insolvency and Bankruptcy Code
- The Insolvency and Bankruptcy Code (IBC) has facilitated the exit of distressed firms, thereby allocating scarce economic resources towards more productive use.
- Since the inception of the IBC in December 2016, 5,893 Corporate Insolvency Resolution Processes (CIRPs) had commenced by end-September 2022, of which 67 per cent have been closed.
- The Code also provides for a Corporate Debtor (CD) to voluntarily liquidate itself subject to the fulfilment of certain conditions as prescribed under the Code. 1,351 corporate persons initiated voluntary liquidation under the Code as of end-September 2022.
- Sectoral analysis reveals that 52 per cent of the ongoing CIRPs belong to industry, followed by 37 per cent in the services sector by September 2022.
- Further, within the industry, 74 per cent of the initiated CIRPs was from the manufacturing sector. Of these, the textile, basic metals and food sectors accounted for 48 per cent of the ongoing CIRPs.
- While in the services sector, 60 per cent of the ongoing CIRPs belongs to real estate, renting and business activities.
- As per the RBI data, in FY 22, the total amount recovered by SCBs under IBC has been the highest compared to other channels such as Lok Adalat’s, SARFAESI Act and DRTs in this period.
Capital Markets
- Global macroeconomic uncertainty, unprecedented inflation, monetary policy tightening, volatile markets, etc., resulted in hurting investor sentiments, leading to a downbeat performance of global capital markets in FY23. Though global macroeconomic and financial market developments exercised some influence on Indian capital markets, India’s capital market had a good year, overall.
- Compared to FY22, the number of firms opting to list on the bourses increased by 37 per cent, though the amount raised declined to almost half of what was raised in the last year.
- In April-November 2022, the amount of resources mobilised by the issuance of debt securities in the primary market increased by 5 per cent, compared to the corresponding period last year.
- Compared to FY22 (until November 2021), this year, not only did the number of SMEs coming with IPOs almost double, but the total funds raised by them were almost three times the funds raised by them in the same period last year.
- India VIX, which measures expected short-term volatility in the stock market, rose to a high of 32.0 on 24th February 2022 with the outbreak of the Russia-Ukraine conflict. In April-November 2022, the India VIX witnessed a declining trend as the impact of the conflict started to wane as the year progressed.
| Major Stock Market Indices | |
| Index | Country |
| Shanghai Composite | China |
| Ibovespa | Brazil |
| KOSPI | Korea |
| Nasdaq; Dow Jones; and S&P 500 | USA |
| CAC | France |
| DAX | Germany |
| FTSE 100 | UK |
| Hang Seng | Hong Kong |
| Nikkei | Japan |
Foreign Portfolio Investments
- Global economic factors, such as inflationary pressures, monetary tightening by central banks and recessionary fears in Advanced Economies, exerted pressure on FPIs to sell in Indian markets.
- However, on account of the strong macroeconomic fundamentals of the Indian economy, the market witnessed an increase despite the outflows driven by global factors. The total assets under custody with FPIs increased by 3.4 per cent at the end of November 2022 compared to November 2021.
- The overall net investments by Foreign Portfolio Investors during FY23 registered an outflow of Rs. 16,153 crore at the end of December 2022 from an outflow of Rs. 5,578 crore during FY22 at the end of December 2021, with both the equity segment and the debt segment witnessing net FPI outflows.
- Investments by Domestic Institutional Investors (DIIs) acted as a countervailing force against FPI outflows during recent years, rendering the Indian equity market relatively less susceptible to large scale corrections.
- Net DII inflows and net investment by mutual funds in equities were observed during FY23 (until November 2022).
| IFSC – GIFT City |
|
Insurance Market
- Insurance, an integral part of the financial sector, plays a significant role in economic development. Apart from protecting against mortality, property, and casualty risks and providing a safety net, the insurance sector encourages savings and provides long-term funds for infrastructure development. The development of the insurance sector is necessary to support its continued economic transformation.
- Internationally, the potential and performance of the insurance sector are generally assessed based on two parameters, viz.,
- insurance penetration, which refers to the ratio of total insurance premiums to Gross Domestic Product (GDP) in a year and
- insurance density, which refers to the ratio of insurance premium to population, i.e., insurance premium per capita and is measured in US Dollar, as they reflect the level of development of the insurance sector in a country.
- To facilitate the penetration of insurance to the lower income segments of the population, the Insurance Regulatory and Development Authority of India (IRDAI) issued IRDAI (Micro Insurance) Regulations, 2015, which provide a platform for distributing insurance products that are affordable for the rural and urban poor and promote financial inclusion.
- Insurance penetration in India increased steadily from 2.7 per cent around the turn of the millennium to 4.2 per cent in 2020 and remained the same in 2021. Life insurance penetration in India was 3.2 per cent in 2021, almost twice more than the emerging markets and slightly above the global average.
- Government schemes and financial inclusion initiatives have driven insurance adoption and penetration across all segments. The government’s flagship initiative for crop insurance, Pradhan Mantri Fasal Bima Yojana (PMFBY), has led to significant growth in the premium income for crop insurance. Ayushman Bharat (Pradhan Mantri Jan Arogya Yojana) (AB PMJAY) aims at providing a health cover for secondary and tertiary care hospitalisation.
| Government Insurance schemes |
|
05. Prices and Inflation: Successful Tight-Rope Walking
- Rising prices are always a cause of concern for policymakers as they hurt the common man the most. The perils of inflation are felt more in developing economies, where necessities have a higher share in the consumption basket than in developed countries.
Key Points
- In recent years, India’s inflation rate has been well-behaved, lying tamely below the RBI target rate of 4 per cent from 2017 to 2019.
- In 2020, supply-side disruptions pushed inflation beyond the RBI’s upper tolerance limit of 6 per cent. The pandemic delivered a larger shock on supply than it did on demand. In turn, this aggravated cost-push inflation in the country.
- As the pandemic receded, the conflict in Russia-Ukraine broke out, bringing in its wake worldwide inflation, fuelled mostly by surging prices of crude oil and other commodities.
- A convalescing world economy was left to confront unprecedented rates of inflation. The spectre of stagflation loomed large on the horizon.
- In response, developed economies were left with no option but to raise interest rates. As the US Federal Reserve raised rates, the US dollar appreciated, making dollar-denominated fuel imports even dearer.
- India’s commendable inflation management comprised fiscal and monetary measures to stave off the pandemic-induced economic woes. India chose not to overstimulate, and hence price pressures due to the Russia-Ukraine conflict could be contained.
- However, excessive heat in summer and uneven rainfall thereafter in some parts of the country affected the farm sector, reducing supply and causing prices of some major products to rise.
- India’s inflation rate peaked in April 2022 at 7.8 per cent before moderating to 5.7 per cent in December 2022 on the back of good monsoons as well as prompt government measures that ensured adequate food supply.
- Global economic slowdown and interest rate increases brought down commodity prices, contributing to a substantial decline in wholesale price inflation. Thus, input price pressures on Indian manufacturers abated.
- Even as inflation abated at the wholesale level, there has been a pass-through of previously high input costs onto retail prices. Further, with the recovery of demand, there has been a pickup in service inflation.
Domestic Retail Inflation
- Retail price inflation mainly stems from the agriculture & allied sector, housing, textiles, and pharmaceutical sectors. Further, the imported inflation driven by price pressures in energy, mining, chemicals, and machinery reaches the retail segment mainly through the wholesale price inflation.
- FY22 witnessed lower CPI-Combined (CPI-C) based retail inflation as compared to FY21. During FY22, some sub-groups such as ‘oils & fats’, ‘fuel & light’ and ‘transport & communication’ reported high inflation.
- Food inflation based on Consumer Food Price Index (CFPI) climbed to 7.0% in FY23 from 3.8% in FY22. In FY23, retail inflation was mainly driven by higher food inflation, while core inflation stayed at a moderate level.
- While the current fiscal year saw rural and urban inflation closely tracking each other, FY22 had seen a wider differential between the two. The gap between rural and urban inflation was due to a difference in the experience of food inflation. Urban areas experienced a sharper increase in food prices of vegetables and oils during this time as compared to the hinterlands.
| Average Annual Retail Inflation Based on CPI-C (per cent) (base: 2012=100) | |||||
| Groups | Weight | FY20 | FY21 | FY22 | FY23* |
| Food & beverages | 45.9 | 6.0 | 7.3 | 4.2 | 7.0 |
| Pan, tobacco & intoxicants | 2.4 | 4.2 | 9.9 | 4.5 | 2.0 |
| Clothing & footwear | 6.5 | 1.6 | 3.4 | 7.2 | 9.7 |
| Housing | 10.1 | 4.5 | 3.3 | 3.7 | 4.1 |
| Fuel and light | 6.8 | 1.3 | 2.7 | 11.3 | 10.5 |
| Headline Inflation | 100.0 | 4.8 | 6.2 | 5.5 | 6.8 |
| Core Inflation | 47.3 | 4.0 | 5.5 | 6.0 | 6.1 |
| Food Inflation | 39.1 | 6.7 | 7.7 | 3.8 | 7.0 |
|
Source: MoSPI, Note: *April-December, CPI data for December 2022 are provisional |
|||||
Domestic Wholesale Price Inflation
- WPI-based inflation remained low during the COVID-19 period, and it started to gain momentum in the post-pandemic period as economic activities resumed. The Russia-Ukraine conflict further exacerbated the burden as it worsened global supply chains.
- The wholesale inflation rate climbed to about 13.0% in FY22. Prices of items like petroleum products, basic metals, chemicals & chemical products, and edible oils, with maximum exposure to international pricing translated into a rise in the domestic WPI inflation.
- Part of WPI inflation is imported inflation. The high import dependence on edible oils has meant that the transitory effect of rising international prices of these products are also reflected in domestic prices.
- Capital outflows in H1 of FY23 had impacted India’s exchange rate adversely; this was another reason for high prices of imported inputs, which are mostly dollar-denominated.
Convergence of WPI and CPI Inflation
- While the pass-through of international prices to wholesale prices is relatively quick, it impacts retail prices with a lag. This creates a wedge between WPI and CPI inflation rates. It is also due to the difference in composition and weights assigned to different commodities in the two indices.
- The headline inflation based on WPI and the CPI-C started diverging in March 2021. The wedge between CPI-C and WPI inflation continued to widen before reaching its peak at 10% in November 2021. Thereafter, the gap began to narrow until April 2022.
- It was only after global commodity prices, including crude oil, softened and the effects of strong supporting domestic factors like favourable monsoon, vaccination-led economic resumption, etc., started to be felt that the wedge began to narrow, and it closed in November 2022.
- The convergence between the WPI and CPI indices was mainly driven by two factors:
- Cooling in inflation of commodities such as crude oil, iron, aluminium and cotton led to a lower WPI.
- CPI inflation rose due to an increase in the prices of services. Services form a part of the core component of the CPI-C but are not included in the WPI basket.
Monetary Policy Measures for Price Stability
- Reserve Bank of India's Monetary Policy Committee (MPC) increased the policy repo rate under the liquidity adjustment facility (LAF).
- It was increased by 2.25% (225 basis points) from 4.0% to 6.25% between May and December 2022.
Housing Prices: Recovering Housing Sector after the Pandemic
- Housing prices provide helpful information on the state of the economy via booms and busts in asset markets, which give rise to economic imbalances. Movements in these prices affect consumption spending through its effects on household wealth and consumer confidence.
- The National Housing Bank (NHB) publishes two Housing Price Indices (HPI), namely ‘HPI assessment price’ and ‘HPI market price quarterly’, with FY18 as the base year.
- HPI assessment price is based on the valuation prices of residential units collected from primary lending institutions.
- In contrast, the HPI market price is based on the market prices for unsold inventories collected from developers.
- A composite index is calculated for 50 cities across India using the population of the cities as weights.
- Out of the 50 cities, 43 saw an increase in the Housing Price Index, whereas 7 cities showed a decline annually.
- All of the eight major metros of the country, viz., Ahmedabad, Bengaluru, Chennai, Delhi, Hyderabad, Kolkata, Mumbai and Pune, recorded increases in the index on an annual basis.
- The overall increase in composite HPI assessment and HPI market prices indicates a revival in the housing finance sector.
Keeping check on Pharmaceutical Prices
- The principles for the regulation of the prices of drugs are based on the National Pharmaceuticals Pricing Policy, 2012, administered by the Department of Pharmaceuticals. The key principles of the policy are the essentiality of drugs, control of formulation prices and market-based pricing.
- Pradhan Mantri Bhartiya Janaushadhi Pariyojana (PMBJP) was launched to make quality generic medicines available at affordable prices to all. Under this scheme, dedicated outlets known as Janaushadhi Kendras are opened to provide quality generic medicines at affordable prices to all and especially to the poor and the deprived.
- Pradhan Mantri Bhartiya Janaushadhi Kendras (PMBJKs) also provide self-employment with sustainable and regular earnings opportunities. Under the PMBJP, until December 2022, more than 9000 PMBJKs have been opened across the country.
Conclusion
- India’s inflation management has been particularly noteworthy and can be contrasted with advanced economies that are still grappling with sticky inflation rates. The inflation challenge in FY24 must be a lot less stiff than it has been this year. Monetary and fiscal authorities are expected to be as proactive and vigilant as they have been this year.
06. Social Infrastructure and Employment: Big Tent
- The country has continued to make good progress in increasing incomes and improving the standard of living over the past decades. The social sector expenditure outlay of the Centre and State Governments has increased steadily in FY23.
Key Points
- The socio-economic milieu and unique ethos of India reside in the diverse and expansive populace transcending innumerable cultures, languages, and geographies, constituting the real wealth of the country.
- Realising the immense potential harboured by the young and aspirational citizens spanning numerous cities and villages requires ambitious vision and meticulous implementation, customising for the diversity of circumstances and special needs of different sections.
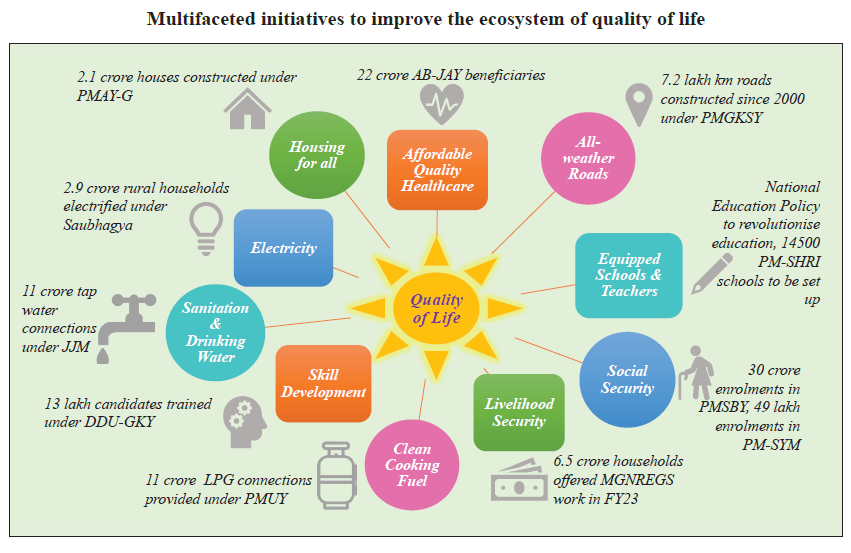
- The foundational services and structures that support society in availing various amenities important for a better quality of life, i.e. the social infrastructure, indirectly contributes to economic development by laying the foundation for enhancement in income, productivity growth, and technological advancement.
- With the overall development of the economy, the concept of quality of life has enlarged to include many more elements than the traditional metrics of income (which determine the availability of basic requirements such as food and shelter) and education levels. It now encompasses access to clean drinking water, sanitation, employment prospects, health care, social security, connectivity, etc.
- This is all the more pertinent in the contemporary scenario as India has adopted the UN SDGs 2030, which are a set of comprehensive, far-reaching, and people-centric universal and transformative goals and targets. Many of these seventeen goals concern the social well-being of individuals.
Social Sector Expenditure
- The share of expenditure on social services in the total expenditure of the Government has been around 25 per cent from FY18 to FY20. It increased to 26.6 per cent in FY23 (BE).
- While the social sector expenditure outlay of the Centre and State governments was Rs. 12.8 lakh crore in FY19, it has increased steadily to stand at Rs. 21.3 lakh crore in FY23 (BE).
- The share of expenditure on health in the total expenditure on social services, has increased from 21 per cent in FY19 to 26 per cent in FY23 (BE).
- Also, the Fifteenth Finance Commission, in its report, had recommended that public health expenditure of Union and States together should be increased in a progressive manner to reach 2.5 per cent of GDP by 2025.
- In keeping with this objective, Central and State Governments’ budgeted expenditure on the health sector reached 2.1 per cent of GDP in FY23 (BE) and 2.2 per cent in FY22 (RE), against 1.6 per cent in FY21.
Improving Human Development Parameters
- According to United Nations Development Programme (UNDP) report, India ranked 132 out of 191 countries and territories in the 2021/2022 HDI report.
- India’s HDI value of 0.633 in 2021 places the country in the medium human development category, lower than its value of 0.645 in 2019. However, India’s HDI value continues to exceed South Asia’s average human development due to priority placed on investment in social infrastructure, including ensuring universal health and education.
- On the parameter of gender inequality, India’s Gender Inequality Index (GII) value is 0.490 in 2021 and is ranked 122. This score is better than that of the South Asian region (value: 0.508) and close to the world average of 0.465.
- This reflects the Government’s initiatives and investments towards more inclusive growth, social protection, and gender-responsive development policies.
- The findings of the report suggest that in India, 41.5 crore people exited poverty between 2005-06 and 2019-21, demonstrating that the SDG target 1.2 of reducing at least by half the proportion of men, women, and children of all ages living in poverty in all its dimensions according to national definitions by 2030 is possible to achieve.
| UNDP Multidimensional Poverty Index 2022 |
|
Aspirational Districts Programme
- The Government of India launched the ‘Transformation of Aspirational Districts’ (Aspirational Districts Programme (ADP)) initiative in January 2018 with a vision of a New India by 2022 wherein the focus is to raise living standards of its citizens and ensuring inclusive growth.
- 117 Aspirational Districts (ADs) across 28 States/UTs have been identified by NITI Aayog based upon composite indicators ranging from health and nutrition, education, agriculture, and water resources, financial inclusion and skill development, and basic infrastructure which have an impact on HDI.
- The broad contours of the programme are Convergence (of Central & State Schemes), Collaboration (of Central, State level Nodal Officers & District Collectors), and Competition among districts through monthly delta ranking; all driven by a mass movement.
- With States as the main drivers, this programme focuses on the strength of each district, identifying low-hanging fruits for immediate improvement and measuring progress by ranking districts every month.
- All districts have made significant improvements across different indicators for instance, under Health and Nutrition, 46 districts have improved by up to 45 per cent, and 23 districts have improved by up to 69 per cent in critical indicators related to pregnant women’s health.
Progressing Labour Reform Measures
- In 2019 and 2020, 29 Central Labour Laws were amalgamated, rationalised, and simplified into four Labour Codes, viz.,
- the Code on Wages, 2019,
- the Industrial Relations Code, 2020,
- the Code on Social Security, 2020, and
- the Occupational Safety, Health & Working Conditions Code, 2020.
- The new laws are in tune with the changing labour market trends and, at the same time, accommodate the minimum wage requirement and welfare needs of the unorganised sector workers, including the self-employed and migrant workers.
- The Labour Codes have been aligned with the present economic scenario and technological advancements along with reduction in multiplicity of definitions and authorities. The Codes also ease compliance mechanism aiming to promote ease of doing business/setting up of enterprises.
- Use of technology, such as, web-based Inspection has been introduced in order to ensure transparency and accountability in enforcement. Decriminalisation of minor offences has also been provided in the Labour Codes.
- The Ministry of Labour and Employment has developed e-Shram portal for creating a national database of unorganised workers. It captures details of workers like name, occupation, address, occupation type, qualification etc., for the optimum realisation of their employability and extend the benefits of the social security schemes to them.
Improving Employment Trends
- Employment trends can be studied from
- the supply side of labour through household surveys such as the PLFS conducted by the Ministry of Statistics and Programme Implementation (MoSPI), and
- the demand side of labour through enterprise or establishment surveys such as the Annual Survey of Industries (ASI) by MoSPI, Quarterly Employment Survey (QES) by Labour Bureau, etc.
- Labour markets have recovered beyond pre-COVID-19 levels, in both urban and rural areas, with unemployment rates falling from 5.8 per cent in 2018-19 to 4.2 per cent in 2020-21, and a noticeable rise in rural FLFPR (female labour force participation rate) from 19.7 per cent in 2018-19 to 27.7 per cent in 2020-21.
- More recent urban employment data shows progress beyond pre-pandemic levels as the unemployment rate declined from 8.3 per cent in July-September 2019 to 7.2 per cent in July-September 2022.
- Based on the industry of work, the share of workers engaged in agriculture rose marginally from 45.6 per cent in 2019-20 to 46.5 per cent in 2020-21; the share of manufacturing declined faintly from 11.2 per cent to 10.9 per cent; the share of construction increased from 11.6 per cent to 12.1 per cent; and share of trade, hotel & restaurants declined from 13.2 per cent to 12.2 per cent, over the same period.
- More than 75 per cent of rural female workers are employed in the agricultural sector. This implies a need to upskill and create employment for women in agriculture-related sectors such as food processing.
- Here, the self-help groups (SHGs) can play a crucial role in shaping rural women’s potential into concrete developmental outcomes of financial inclusion, livelihood diversification, and skill development.
- The Government has been taking several measures to enhance the reach of employment opportunities to all eligible and willing to work. One such measure is the National Career Service (NCS) project. Launched in July 2015, it works towards bridging the gap between candidates and employers; candidates seeking training and career guidance and agencies providing training and career counselling.
| NOTE: Quarterly Employment Survey (QES) conducted by the Labour Bureau, covers establishments with ten or more workers in nine major sectors viz. manufacturing, construction, trade, transport, education, health, accommodation & restaurants, IT/BPOs, and financial services. |
Ensuring Quality Education for All
- The importance of education for all cannot be over-emphasised as it is the foundation of every individual and society’s development. As remarked by Dr. A.P.J Abdul Kalam – ‘Learning gives creativity, creativity leads to thinking, thinking leads to knowledge, and knowledge makes you great!’
- Education, apart from enhancing the employability of the working-age population, also has an equalising impact in breaking the cycles of poverty and social marginalisation. “Quality Education” which is enlisted as Goal 4 under UN SDGs, aims to “Ensure inclusive and equitable quality education and promote lifelong learning opportunities for all” by 2030.
- Recognising that education is the lifeblood of human capital formation for a young country like India, the National Education Policy 2020 provided for the revision and revamping of all aspects of the education structure. The NEP provides for nurturing all-around development and skill acquisition by youth in an inclusive, accessible, and multilingual set-up.
- The year FY22 saw improvement in Gross Enrolment Ratios (GER)34 in schools and improvement in gender parity. School dropout rates36 at all levels have witnessed a steady decline in recent years.
- The schemes such as Samagra Shiksha, RTE Act, improvement in school infrastructure & facilities, availability of teachers, free textbooks & uniforms, Kasturba Gandhi Balika Vidyalaya and the PM POSHAN Scheme play an important role in enhancing enrolment and retention of children in schools.
- The Government launched a Centrally Sponsored Scheme (CSS) called PM Schools for Rising India (PM SHRI) in September, 2022. These schools will be equipped with modern infrastructure and showcase the implementation of the NEP and emerge as exemplary schools over a period of time, while offering leadership to other schools in the neighbourhood.
- With a focus on developing cognitive, affective, and psychomotor abilities and also early literacy and numeracy for students in the age groups of 3+, 4+ and 5+ years, Project Balvatika, i.e.,‘Preparatory Class’, was lauched in October 2022 in 49 Kendriya Vidyalayas.
- PRASHAST, a Disability Screening mobile app, has been launched, covering 21 disabilities. PRASHAST App will help in screening disability conditions at the school level and will generate the schoolwise report, for further sharing with the authorities for initiating the certification process, as per guidelines of Samagra Shiksha.
- Strengthening Teaching-Learning and Results for States (STARS) Project is being implemented as a CSS in six states namely Himachal Pradesh, Madhya Pradesh, Rajasthan, Maharashtra, Odisha and Kerala over a period of 5 years i.e., till FY25, partly funded by a loan from the World Bank. The objective of the Scheme is to improve the quality and governance of school education in the selected states.
- With the aim of strengthening schools and improving the quality of school education through community, the Government has initiated Vidyanjali (a school volunteer management program). It enables volunteers/organisations to interact and connect directly with the Government schools and share their knowledge and skills and/or contribute in the form of assets/material/equipment.
Quality and Affordable Health for All
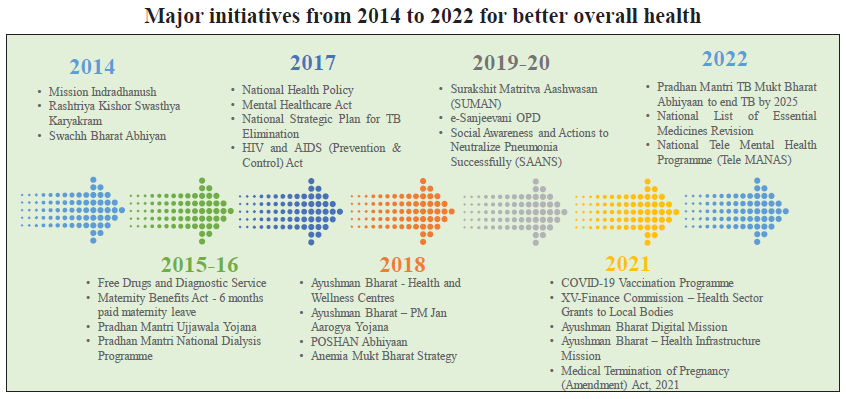
- Ensuring the provision of quality health facilities to citizens is an important priority for the Government. Towards this objective, multidimensional initiatives have been launched and carried forward for better overall health of the citizens.
- With concerted efforts made under the Reproductive, Maternal, New-born, Child, Adolescent Health Plus Nutrition (RMNCAH+N) strategy, India has made considerable progress in improving the health status of both mothers and children.
- As per the Sample Registration System (SRS) data, India has successfully achieved the major milestone to bring the Maternal Mortality Ratio (MMR) to below 100 per lakh live births by 2020 (laid down in National Health Policy 2017) by bringing it down to 97 per lakh live births in 2018-20 from 130 per lakh live births in 2014-16.
- Eight states have already achieved the SDG target to reduce MMR to less than 70 per lakh live births by 2030. These include Kerala (19), Maharashtra (33), Telangana (43) Andhra Pradesh (45), Tamil Nadu (54), Jharkhand (56), Gujarat (57), and Karnataka (69).
- The National Health Account (NHA) estimates for FY19 show that there has been an increase in the share of Government Health Expenditure (GHE) in the total GDP from 1.2 per cent in FY14 to 1.3 per cent in FY19. Additionally, the share of GHE in Total Health Expenditure (THE) has also increased over time, standing at 40.6 per cent in FY19, substantially higher than 28.6 per cent in FY14.
India’s Aspiring Rural Economy
- The percentage of the population living in India’s rural areas was as high as around 80 per cent in the 1960s and remained over 70 per cent till 2007. It presently stands at 65 per cent for 2021. Further, 47 per cent of the population is dependent on agriculture for livelihood.
- The aim of engagement of the government in the rural economy has been “transforming lives and livelihoods through proactive socio-economic inclusion, integration, and empowerment of rural India.
- Various measures have been taken to enhance the quality of life in rural areas encompassing rural housing, drinking water, and sanitation, clean fuel, social protection, rural connectivity along with enhancing rural livelihoods.
- The financing needs of rural households and small businesses are being met through microfinance institutions, self-help groups (SHGs), and other financial intermediaries. Taking digitisation and technology to the rural economy has also been a key aspect of the rural development agenda.
Enhancing Rural Governance for Inclusive Growth
- Good rural governance is imperative to help translate various programmes and schemes of the Government at the grassroots level, ensure equal rights to all, and achieve sustainability of rural development programmes.
- A CSS of Rashtriya Gram Swaraj Abhiyan (RGSA) was approved by the Union Cabinet in April 2018 for implementation from FY19 to FY22 with the primary aim of strengthening Panchayati Raj Institutions (PRIs). The major focus of the scheme of RGSA was Capacity Building and Training (CB&T) to empower PRIs.
- SVAMITVA (Survey of Villages and Mapping with Improvised Technology in Village Areas) is a Central Sector Scheme launched on 24April 2020, the National Panchayati Raj Day. The scheme aims to provide the ‘Record of Rights’ to village household owners possessing houses in inhabited rural areas. The scheme covers multifarious aspects viz. facilitating monetization of properties & enabling bank loans; reducing property-related disputes; comprehensive village-level planning, etc.
Conclusion
When different aspects of human development like education, skill, employment, health, and rural development are dovetailed with technology, all-round revolutionary innovation resulting in technology-led growth and prosperity follows. For equitable development, a country as vast and diverse as India requires the implementation of broad-based inclusive social policies, supported by adequate and commensurate financial resources.
07. Climate Change and Environment: Preparing to Face the Future
- The global nature of climate change makes India one of the most vulnerable regions. While India is less responsible for the high stock of emissions, it has consistently engaged in demonstrating global leadership towards adopting various measures and ensuring a low-emission growth pathway with a commitment to the net-zero emissions goal by 2070.
Key Points
- Climate change is the long-term change in temperature and weather patterns that can occur due to natural reasons, but since the beginning of the industrial revolution in the 19th century, it has been predominantly due to anthropogenic activities.
- GHG emissions remain in the atmosphere for tens to hundreds of years, trapping the sun’s heat from escaping. While within limits, these make our earth more habitable, allowing for salubrious weather conditions, the enhanced emissions have led to rising temperatures with the potential to bring about sea level rise, change monsoon cycles and impact land systems.
- GHG emissions are the most significant threat to humanity and the inescapable reality the world faces. Action to reduce carbon emissions and adapt to the changing climatic conditions are required urgently as the world has already started to experience its consequences.
- Much of the global angst associated with climate change is about the emission of GHGs and carbon, in particular. The more GHGs are emitted, the more they stay trapped in the atmosphere, accelerating global warming.
- Hence, if some of the cataclysmic consequences are to be avoided, then global warming must be arrested, slowed and, if possible, reversed. One way to strive for it is to reduce emissions of GHG, including carbon. Many nations pledge to reduce their net emission to zero by 2060 and by 2070.
- However, much carbon dioxide and other GHGs have already been emitted over the last two and half centuries of industrialisation-led economic growth in today’s advanced nations. The share of developing countries in the stock of GHGs has been minimal compared to developed countries.
- The impact of the accumulation would also be iniquitous, with the developing countries not only bearing the brunt of climate change but also constrained by their capacity to respond to its challenges. Ironically, the burden of adaptation is highest for those who have contributed the least to global warming.
- Here, India is considered to be one of the most vulnerable countries given its long coastline, monsoon-dependent agriculture, and large agrarian economy. India has been striving to pursue the goal of sustainable development. It spearheads one of the most robust climate actions.
Progress on India’s Climate Action
- In 2008, India launched the National Action Plan on Climate Change (NAPCC), establishing eight National Missions, covering several initiatives and a slew of measures in the area of solar, water, energy efficiency, forests, sustainable habitat, sustainable agriculture, sustaining Himalayan ecosystem, capacity building and research and development (R&D).
- Demonstrating higher ambition in its climate action, the Government of India submitted its updated NDC in August 2022.
- NDC’s three quantitative targets to be achieved up to 2030 are:
- Cumulative electric power installed capacity from non-fossil sources to reach 40%.
- Reduction in the emissions intensity of GDP by 33 to 35% (compared to 2005 levels).
- Creation of additional carbon sink of 2.5 to 3 billion tonnes of CO2 equivalent through additional forest and tree cover.
- The vision “Panchamrit” given at the UNFCCC Conference of Parties (COP 26) in Glasgow mentions sustainable lifestyles and climate justice to protect the poor and vulnerable from the adverse impacts of climate change.
- Carbon Stock in India’s Forest and Tree Cover
- The Indian State of Forest Report (ISFR) estimates the carbon stock of forests to be about 7,204 million tonnes in 2019, which is an increase of 79.4 million tonnes since the previous 2017 estimates.
- Carbon emissions sequestrated through forest and tree cover is 30.1 billion tonnes.
- Arunachal Pradesh has the maximum carbon stock in forests (1023.84 million tonnes), followed by Madhya Pradesh (609.25 million tonnes).
- River Conservation and Rejuvenation
- The government released Detailed Project Reports (DPR) for the rejuvenation of 13 major rivers.
- Under DPRs, major works include afforestation on riverbanks, prevent soil erosion, recharge the groundwater table, sequester carbon dioxide, catchment area treatment, ecological restoration, moisture conservation, livelihood improvement & income generation, etc.
- Approach to Transition to Renewable Energy Sources
- As per the updated NDCs, India is striving to achieve the target of 50% cumulative electric power installed capacity from non-fossil fuel-based energy resources by 2030.
- Total investment in renewables in India stood at $78.1 billion.
- Green Hydrogen: A critical source of alternate energy
- National Green Hydrogen Mission will facilitate demand creation, production, utilisation and export of Green Hydrogen and mobilisation of over Rs. 8 lakh crore of investment by 2030.
- The adoption of green hydrogen will result in 3.6 Giga tonnes of cumulative CO2 emission reduction by 2050.
- Long-Term Low Emissions Development Strategy (LT-LEDS)
- LT-LEDS has been prepared in the framework of India’s right to an equitable and fair share of the global carbon budget and is the practical implementation of India’s call for “climate justice.”
- The LT-LEDS is driven by the vision of LiFE, Lifestyle for the Environment that calls for a worldwide paradigm shift from mindless and destructive consumption to mindful and deliberate utilisation.
Finance for Sustainable Development
- Finance is a critical input in India’s climate actions. The country’s climate actions have so far been largely financed from domestic sources, including government budgetary support, a mix of market mechanisms, fiscal instruments, and policy interventions.
- Green bonds are financial instruments that generate proceeds for investment in environmentally sustainable and climate-suitable projects. With the growing focus on the environmental sustainability of projects, green bonds have become widely accepted as an instrument to raise funds to support climate and environmental projects.
- As per SEBI’s data on green debt securities, 15 Indian corporates have issued green bonds of value Rs. 4,539 crore between the period of 2017 to September 2022. Most of these are related to renewable energy generation.
- In keeping with the ambition to reduce the carbon intensity of the economy significantly, the Union Budget 2022-23 announced the issue of Sovereign Green Bonds. The issuance of Sovereign Green Bonds will help the government to tap the requisite finance from potential investors for deployment in public sector projects aimed at reducing the carbon intensity of the economy.
- Over time, RBI has incentivised bank lending towards greener industries and projects. For example, renewable energy projects have been included under Priority Sector Lending (PSL).
India’s Initiatives at the International Stage
- The International Solar Alliance (ISA) is a treaty-based inter-governmental organisation working to create a global market system to tap the benefits of solar power and promote clean energy applications.
- Coalition for Disaster Resilient Infrastructure (CDRI) aims to promote the resilience of infrastructure systems to climate and disaster risks, thereby ensuring sustainable development.
- The LeadIT (launched by the governments of Sweden and India) gathers countries and companies that are committed to action to achieve the Paris Agreement.
Initiatives Related to other Environmental Issues
- Conservation of biodiversity is crucial as it provides resources and services necessary for human beings and for the sustenance of all living beings. It enhances ecosystem productivity, where each species, however small, has an important role to play.
- India and Nepal signed a Memorandum of Understanding (MoU) on biodiversity conservation to strengthen and enhance the coordination and cooperation in the field of forests, wildlife, environment, biodiversity conservation, and climate change, including restoration of corridors and interlinking areas and sharing knowledge and best practices between the two countries.
- The Wild Life (Protection) Amendment Act, 2022 aims to rationalise the schedules by:
- Reducing the number of schedules for specially protected animals to two,
- Removing the schedule for vermin species, and
- Inserting a new schedule for specimens listed in the Appendices under CITES (scheduled specimens).
- In July 2022, a ban was imposed on the manufacture, import, stocking, distribution, sale, and use of identified single-use plastic items, which have low utility and high littering potential, all across the country.
- The Government published the Battery Waste Management Rules, 2022, to ensure environmentally sound management of waste batteries. The new rules cover all types of batteries, viz. Electric Vehicle batteries, portable batteries, automotive batteries, and industrial batteries.
- The e-Waste (Management) Rules, 2022 will launch a new Extended Producer Responsibility (EPR) regime for e-waste recycling. Under these rules, a provision for reducing hazardous substances in the manufacturing of Electrical and Electronic Equipment (EEE) has been provided.
| COP15 to the CBD |
|
Conclusion
India is spearheading one of the world’s most ambitious clean energy transitions and remains steadfast in its commitment to combating climate change. Despite the adverse impacts of COVID-19 on the economy, India has enhanced its climate ambition manifold and embarked on a long-term strategy towards a Low GHG Emission Development Strategy by adopting a multi-pronged approach.
08. Agriculture and Food Management: from Food Security to Nutritional Security
With its solid forward linkages, the agriculture and allied activities sector significantly contributed to the country's overall growth and development by ensuring food security.
Key Points
- The performance of the agriculture and allied sector has been buoyant over the past several years. This buoyancy could be ascribed to the measures taken by the Government to promote farmer-producer organisations, encourage crop diversification, and improve productivity in agriculture.
- The Indian agriculture sector has been growing at an average annual growth rate of 4.6% during the last six years. In recent years, India has also rapidly emerged as the net exporter of agricultural products.
Record Production of Foodgrains
- The production of food grains and oil seeds has been increasing Year-on-Year (YoY), as per Fourth Advance Estimates for 2021-22. Production of pulses has also been notably higher than the average of 23.8 million tonnes in the last five years.
- However, as indicated earlier changing climate has been impacting agriculture adversely. The year 2022 witnessed an early heat wave during the wheat-harvesting season, adversely affecting its production. The year experienced a decline in the sown area for paddy cultivation too in the Kharif season due to delayed monsoons and deficient rainfall.
- Despite a fall in the sown area of Kharif paddy, the total production of Kharif rice during 2022-23 is estimated at 104.9 million tonnes, which is higher than the previous five years (2016-17 to 2020-21) average Kharif rice production of 100.5 million tonnes.
MSP to Ensure Returns Over the Cost of Production
- The Union Budget for 2018-19 announced that farmers in India would be given an MSP of at least one and a half times the cost of production.
- Accordingly, the Government has been increasing the MSP for all 22 Kharif, Rabi and other commercial crops with a margin of at least 50% over the all-India weighted average cost of production since the agricultural year 2018-19.
- Given nutritional requirements and changing dietary patterns and to achieve self-sufficiency in pulses and oilseeds production, the Government has fixed relatively higher MSP for pulses and oilseeds.
Enhanced Access to Agricultural Credit
- Banks issued Kisan Credit Cards (KCC) to 3.89 crore eligible farmers with a KCC limit of Rs. 4,51,672 crore in December, 2022.
- As of October 2022, one-lakh KCCs have been sanctioned for the fisheries sector and 9.5 lakh for the animal husbandry sector.
- Under the Modified Interest Subvention Scheme (MISS) scheme, short-term agriculture loan up to Rs. 3 lakh is available at 7% per annum to farmers engaged in Agriculture and other Allied activities to ensure that the farmers pay a minimal interest rate to the banks.
Farm mechanisation- Key to Improving Productivity
- Farm mechanisation helps increase productivity through timely and efficient use of other inputs and natural resources while at the same time reducing the cost of cultivation and the drudgery associated with various farm operations.
- Under the Sub Mission on Agricultural Mechanisation (SMAM), State Governments are being assisted in training and demonstrating agricultural machinery and helping farmers procure various farm machinery and equipment besides setting up Custom Hiring Centres (CHC).
Chemical-free India: Organic and Natural Farming
- Organic and natural farming provides chemical fertiliser and pesticide-free food grains and other crops, improves soil health and reduces environmental pollution.
- India has 44.3 lakh organic farmers, the highest in the world, and about 59.1 lakh ha area was brought under organic farming by 2021-22.
- The Government has been promoting organic farming by implementing two dedicated schemes:
- Paramparagat Krishi Vikas Yojana (PKVY): Under this scheme as of November 2022, almost 32,384 clusters totalling 6.4 lakh ha area and 16.1 lakh farmers have been covered.
- Mission Organic Value Chain Development for North Eastern Region (MOVCDNER): Under this scheme, 177 FPOs/FPCs have been created, covering 1.5 lakh farmers and 1.7 lakh hectares.
Other Important Initiatives in Agriculture
- PM KISAN Scheme: It is a Central Sector Scheme to supplement the financial needs of land-holding farmers. The financial benefit of Rs. 6,000 per year is transferred into the bank accounts of farmer families through DBT.
- Agriculture Infrastructure Fund (AIF): It is a financing facility operational from the year 2020-21 to 2032-33 for the creation of post-harvest management infrastructure and community farm assets, with benefits including 3 per cent interest subvention and credit guarantee support.
- Pradhan Mantri Fasal Bima Yojana (PMFBY): The scheme promises minimal financial burden on the farmer, with farmers paying only 1.5 per cent and 2 per cent of the total premium for the Rabi and Kharif seasons, respectively, with Centre and State Governments bearing most of the premium cost.
- Mission for Integrated Development of Horticulture (MIDH): This scheme to promote horticulture covering fruits, vegetables, root and tuber crops, spices, flowers, plantation crops etc., was introduced in 2014-15. The interventions include introducing improved varieties and quality seeds, incentives for plantation crops, cluster development, and post-harvest management.
- National Agriculture Market (e-NAM) Scheme: The Government of India launched the National Agriculture Market (e-NAM) Scheme in 2016 to create an online transparent, competitive bidding system to ensure farmers get remunerative prices for their produce.
Allied Sectors: Animal Husbandry, Dairying and Fisheries
- The allied sectors of Indian agriculture – livestock, forestry & logging and fishing & aquaculture are gradually becoming sectors of buoyant growth and a potential source of better farm incomes.
- The livestock sector grew at a Compound Annual Growth Rate (CAGR) of 7.9% during 2014-15 to 2020- 21 (at constant prices), and its contribution to total agriculture GVA (at constant prices) has increased from 24.3% in 2014-15 to 30.1% in 2020-21.
- The annual average growth rate of the fisheries sector has been about 7% since 2016-17 and has a share of about 6.7% in total agriculture GVA.
- While India ranks 1st in milk production in the world, it ranks 3rd in egg production and eighth in meat production in the world.
- Pradhan Mantri Matsya Sampada Yojana (PMMSY) marks the highest-ever investment in the fisheries sector in India.
Sahakar-Se-Samriddhi: From Cooperation to Prosperity
- To realise the vision of “Sahakar-Se-Samriddhi”, a renewed impetus was given to the growth of the cooperative sector.
- There are 8.5 lakh registered cooperatives in the country, having more than 29 crore members mainly from the marginalised and lower-income groups in the rural areas, and 98% of villages are covered by Primary Agriculture Credit Societies (PACS).
- Currently, around 19% of agriculture finance is through cooperative societies.
Food Processing Sector: The Sunrise Sector
- During the last five years ending FY21, the food processing industries sector has been growing at an average annual growth rate of around 8.3%.
- 12.2% of persons in the registered manufacturing sector were employed in the food processing sector [Annual Survey of Industries (ASI) 2019-20].
- The value of agri-food exports (including processed food exports) was about 10.9% of India's total exports during 2021-22.
- The Ministry of Food Processing Industries, through the component schemes of Pradhan Mantri Kisan SAMPADA Yojana (PMKSY), provide financial assistance for the overall growth and development of the food processing sector.
- The Production Linked Incentive Scheme for Food Processing Industry (PLISFPI) has the specific mandate to incentivise investments to create global food champions.
- To focus on transporting perishable food products, including horticulture, fishery, livestock and processed products, from the Hilly Areas, North-Eastern States and Tribal Areas, Krishi UDAN 2.0 version was launched in October 2021 as a six-month pilot project.
Food Security: Social & Legal Commitment to the People of the Nation
- The Government is currently running the most extensive legislation-based food security programme in the world, covering about 80 crores of India's population under the National Food Security Act (NFSA), 2013.
- Recently, the government has decided to provide free foodgrains to about 81.35 crore beneficiaries under the NFSA for one year from January 1, 2023.
- The NFSA provided, for coverage of up to 75% of the rural and up to 50% of the urban population highly subsidised food grains at Rs. 1/2/3 per kg for coarse grains/ wheat/rice, respectively, at the rate of 35 kg per family per month to households covered under Antyodaya Anna Yojana (AAY) and at the rate of 5 kg per person per month to priority households (till December 2022).
Conclusion
The performance of the agriculture sector remains critical to growth and employment in the country, and all the initiatives have led to sustainable and inclusive development of the sector. A well-developed food processing sector with improved infrastructure like cold storage and better logistics helps reduce wastage, improve value addition, ensure better farmers' returns, promote employment, and increase export earnings.
09. Industry: Steady Recovery
The industry holds a prominent position in the Indian economy contributing about 30% of total gross value added (GVA) in the country. In FY23, the Indian industry faced some extraordinary challenges as the Russian-Ukraine conflict broke out.
Key Points
- The industry sector’s relevance can be identified through various direct and indirect linkages with other sectors, contributing to economic growth and employment.
- First, it ensures that domestic production can accommodate domestic demand and reduces the reliance on imports. Thereby assisting in the improvement of trade and current account balances.
- Second, industrial growth has multiplier effects, which translates into employment growth. Some industries, such as textiles and construction, have high employment elasticities.
- Third, industrial growth spurs growth in services sectors such as banking, insurance, logistics, etc.
Demand Stimulus to Industrial Growth
- A decrease in overall retail inflation has sustained the pent-up consumer demand in the post-pandemic Indian economy, inducing an industrial recovery despite the global headwinds.
- With world commodity prices now also on a downward trajectory and showing up in declining rates of India’s wholesale inflation, core retail inflation is expected to relent, making domestic consumption demand much stronger to further induce industrial growth in the country.
- An increase in investment demand has been triggered by a jump in the Capex of the central government in the current and the previous year as compared to the pre-pandemic years.
Supply Response of Industry
- The sub-indices of the PMI-Manufacturing indicated an easing pace of input cost pressures, improving supplier delivery times, robust export orders, and future output.
- The sustained growth of manufacturing output is also seen within the overall IIP producing consumer durables in sync with the “pent-up” consumption demand.
- The growth in the 8-core industries has held steady, reflecting a broad momentum in industrial activity. Their growth underscores the importance that nations have been attaching to the indigenous presence of core capacities in the aftermath of the pandemic and the Russia-Ukraine conflict breaking down the global supply chain.
Robust Growth in Bank Credit to Industry
- While a large share of bank credit continues to be assigned to large industries, credit to MSMEs has also seen a significant increase in part assisted by the introduction of the ECLGS, which supports around 1.2 crore businesses of which 95% are MSMEs.
- With the spread between corporate bond yields and marginal costs of funds-based lending rate (MCLR) narrowing, and the volatility in the corporate bond market remaining high, corporates appear to be shifting their sources of financing from bond markets to bank capital where rates have remained stable and predictable.
- All segments within the manufacturing sector (except the textile industry) witnessed growth in credit.
Resilient FDI inflow in Manufacturing Sector
- Annual FDI equity inflows in the manufacturing sector jumped from USD 12.1 billion in FY21 to USD 21.3 billion in FY22 as the pandemic-driven expansionary policies of advanced economies led to a surge in global liquidity.
- Then the Russia-Ukraine conflict and monetary tightening at the global level restricted the FDI equity inflows.
- The government has implemented an investor-friendly FDI policy under which FDI up to 100% is permitted through automatic route in most sectors.
Industry Groups
- Micro, Small and Medium Enterprises (MSMEs)
- The economic impact of the pandemic caused the sector’s share to fall to 26.8% in FY21.
- MSME contribution to the manufacturing sector’s GVA also marginally fell to 36.0% in FY21.
- Various government initiatives like AatmaNirbhar Bharat Package, Udyam portal for MSME registration, Samadhaan Portal, Trade Receivables Discounting System (TReDS) platform, CHAMPIONS (single-window grievance redressal portal for MSMEs), ‘Raising and Accelerating MSME Performance’ scheme (RAMP), etc., aided the resilience of the MSME sector.
- Electronics Industry
- The major drivers of growth in this industry are mobile phones, consumer electronics, and industrial electronics.
- India has become the second-largest mobile phone manufacturer globally.
- The industrial electronics sector is also seeing growth due to improved digitisation and robotics applications in Industry 4.0.
- Some of the initiatives and incentives provided by the government to nurture and enhance the electronics manufacturing base include the PLI scheme for Large Scale Electronics Manufacturing, the PLI scheme for IT hardware, the Scheme for Promotion of Manufacturing of Electronic Components and Semiconductors (SPECS).
- Coal Industry
- Coal availability became a challenge for India’s largely thermal-based power generation plants because of a resurgence in economic activity and the emergence of intense heat waves from early March to mid-May of 2022, increasing the demand for power in the country.
- In the wake of rising international coal prices, the power sector curtailed coal import drastically from 69 MT in FY20 to 45 MT in FY21 and further to 27 MT in FY22.
- To counter these challenges, various measures have been initiated, including private participation in coal production, FDI under the automatic route, auctioning of coal blocks for commercial production, expansion of existing mines and opening of new mines, greater use of mass production technology in mining, mechanisation of loading, development of evacuation infrastructure etc.
- Steel Industry
- Iron and steel exports moderated in the first eight months of the current fiscal owing to a slowdown in the global economy, particularly in Europe and China, and export duty levied to enhance domestic availability.
- Export demand may remain subdued with the global slowdown.
- In the future, the government’s thrust towards infrastructure projects, pick-up in construction and real estate activity, and healthy demand from the automobile sector augur well for the demand for steel products.
- Textile Industry
- In the current financial year, the textile industry has been facing the challenge of moderating exports compared to FY22.
- FDI inflows into the textile sector are yet to recover to pre-pandemic levels.
- To develop integrated large-scale and modern industrial infrastructure facilities for the entire value chain of the textile industry, the government approved the setting up of seven PM Mega Integrated Textile Region and Apparel (PM MITRA) Parks.
- To boost the production capacity, the government launched the Textile PLI Scheme to promote investments and increase the production of Man-Made Fibre (MMF) Apparel, MMF Fabrics and Products of Technical Textiles.
- Pharmaceuticals Industry
- India is ranked 3rd worldwide in the production of pharma products by volume and 14th by value.
- The performance of pharma exports in FY22 has been robust, sustaining growth despite the global trade disruptions and drop in demand for Covid-19-related treatments.
- Automobile Market
- Increase in long-term third-party vehicle insurance premiums has increased the total upfront insurance cost by about 10-11%, especially for two-wheelers.
- Higher borrowing costs and tempering global demand are expected to be near-term hurdles.
- India became the 3rd largest automobile market, surpassing Japan and Germany in terms of sales. In 2021, India was the largest manufacturer of two-wheeler and three-wheeler vehicles and the world’s fourth-largest manufacturer of passenger cars.
- To support and nurture the development of Electric Vehicle (EV) industry, the government has undertaken multiple steps.
India’s Prospects as a Key Player in the Global Value Chain
- As global companies adapt their manufacturing and supply chain strategies to build resilience, India has a unique opportunity to become a global manufacturing hub this decade.
- The three primary assets to capitalise on this unique opportunity are:
- Significant domestic demand
- Government’s drive to encourage manufacturing
- Distinct demographic edge (including a considerable proportion of the young workforce).
- To further enhance India’s integration in the global value chain, ‘Make in India 2.0’ is now focusing on 27 sectors, which include 15 manufacturing sectors and 12 service sectors.
- Amongst these, 24 sub-sectors have been chosen while keeping in mind the Indian industries’ strengths and competitive edge, the need for import substitution, the potential for export and increased employability.
- The government’s efforts towards fostering innovation include incubation, handholding, funding, industry-academia partnership and mentorship.
- The government has also strengthened its IPR regime by modernising the IP office, reducing legal compliances and facilitating IP filing for start-ups, women entrepreneurs, small industries and others.
- As per the Global Innovation Index (GII) 2022 report, India entered the top 40 innovating countries for the first time in 2022 since the inception of the GII in 2007 by improving its rank from 81 in 2015 to 40 in 2022. Further, India became the most innovative nation in the lower middle-income group overtaking Vietnam (48th) and leading the Central and Southern Asia region.
Conclusion
Despite global headwinds, industrial production expanded during FY23, backed by sustained demand conditions. Industrial output in India should continue to grow steadily based on resilient domestic demand.
10. Services: Source of Strength
With the waning of the pandemic and external shocks on account of the Russia-Ukraine conflict, there is evidence of improvement in the performance of various services sub-sectors.
Key Points
- The COVID-19 pandemic hurt most sectors of the economy, with the effect particularly profound for contact-intensive services sectors like tourism, retail trade, hotel, and recreation. On the other hand, non-contact services such as information, communication, financial, professional, and business services remained resilient.
- India’s services sector witnessed a swift rebound in FY22, growing Year-on-Year (YoY) at 8.4% compared to a contraction of 7.8% in the previous financial year, this was driven by growth in the contact-intensive services sub-sector, which bore the maximum burden of the pandemic.
- India has been a major player in services trade, being among the top-10 services exporting countries in 2021, having increased its share in world commercial services exports from 3% in 2015 to 4% in 2021.
Trends in High-Frequency Indicators
- Purchasing Managers Index (PMI) services witnessed a setback with the outbreak COVID-19 pandemic and then the Russia-Ukraine conflict. The indicator moderated in mid-2022, price pressures and unfavourable weather also dampened domestic demand. However, following an overall easing of retail inflation, PMI services witnessed an uptick and expanded to 58.5 in December 2022.
- Bank credit to the services sector has witnessed significant growth since October 2021 with the improvement in vaccination coverage and recovery in the services sector. The credit to services sector saw a YoY growth of 21.3%, credit to NBFCs grew by 32.9%, and credit to the shipping and aviation sector declined by 7.9% and 8.7% respectively.
- Services trade volume surpassed its pre-pandemic peak in the second quarter of 2022, but WTO’s Services Trade Barometer Index reading fell to 98.3 for October 2022. Insofar as India is concerned, some headwinds may be observed in the coming months because of the slowing growth in some of India’s major trading partners. If there is a meaningful economic slowdown in advanced nations, tourism and travel earnings in FY24 may be on the lower side.
- Foreign Direct Investment (FDI) trends in India shows that it received the highest-ever FDI equity inflows in services sector in FY22. The World Investment Report 2022 of UNCTAD places India as the seventh largest recipient of FDI in the top 20 host countries in 2021. To ensure the liberalisation of investment in various industries, the Government has permitted 100% foreign participation in telecommunication services, 20% foreign investment in Life Insurance Corporation (LIC), and raised FDI ceiling in insurance companies from 49 to 74%, under Automatic Route.
Major Services: Sub-Sector-Wise Performance
- Tourism and Hotel Industry
- Global tourism scenario post-pandemic is gradually converging to the pre-pandemic one. As per the World Tourism Barometer of the United Nations World Tourism Organisation, international tourism showed robust performance in the first nine months of 2022, with international tourist arrivals reaching 63% of the pre-pandemic level.
- Foreign tourist arrivals in India in FY23 have been growing month-on-month with the resumption of scheduled international flights and the easing of COVID-19 regulations.
- With infrastructure amenities constantly improving, India is increasingly becoming the preferred destination for MICE (Meetings, Incentives, Conference, Exhibitions) events.
- India is ranked 10th out of the top 46 countries in the World in the Medical Tourism Index FY21 released by Medical Tourism Association. Several factors, such as the presence of world-class hospitals and skilled medical professionals, superior quality healthcare, low treatment costs compared with other countries, credibility in alternative systems of medicine, and increased global demand for wellness services like Yoga and meditation, make India a popular medical tourism destination.
- Real Estate
- Project delays, deferment of big-ticket purchases, stagnation of property prices, and scarce funding for developers induced slackening of real estate demand. The work-from-home model also had an impact on the demand for office space requirements by the corporates.
- With the easing of curbs, there was an increase in interest in the residential housing sector and more so in the readily available and affordable segment. The hybrid work mode with the privileges of working from anywhere encouraged first-time home buyers to move away from the conventional metros, and this brought about a pent-up demand in the residential real estate markets of Tier II and III cities.
- The extension of the Real Estate Regulation Act (RERA) also played a significant role in post-pandemic rebound of Real Estate sector.
- According to JLL’s 2022 Global Real Estate Transparency Index, India’s real estate market transparency is among the top ten most improved markets globally.
- Information Technology-Business Process Management (IT-BPM) Industry
- According to NASSCOM’s report, India’s IT-BPM industry has been exceptionally resilient during the pandemic, driven by increased technology spending, accelerated technology adoption, and digital transformation.
- IT-BPM revenues registered YoY growth of 15.5% during FY22 compared to 2.1% growth in FY21, with all sub-sectors showing double-digit revenue growth.
- Growth in exports was seen across all the major markets, with the USA, Europe (excl. UK), and the UK continues to be the major markets.
- e-Commerce
- The Government’s push to boost the digital economy, growing internet penetration, rise in smartphone adoption, innovation in mobile technologies, and increased adoption of digital payments further accelerated the adoption and growth of e-commerce.
- According to the Global Payments Report by Worldpay FIS, India’s e-commerce market is projected to post impressive gains and grow at 18% annually through 2025.
- As per the latest report ‘How India Shops Online 2022’ by Bain & Company, emerging categories – fashion, grocery, general merchandise – would shore up e-commerce growth in India and would capture nearly two-thirds of the Indian e-commerce market by 2027.
- A recent study by IIFT found that in recent years, MSMEs that adopted digital solutions fared far better than offline MSMEs, assisting them in accessing a large marketplace without incurring huge costs.
- 57% of the total business on Government E-Marketplace (GeM) has come through the MSME units, and female entrepreneurs have contributed over 6%.
- Digital Financial Services
- With a strong foundation provided by the Jan Dhan-Aadhaar-Mobile (JAM) trinity, UPI, and other regulatory frameworks, the pandemic has aided acceleration in digital adoption and provided a fillip to digital financial services solutions by banks, NBFCs, insurers as well as fintech.
- India took the lead with the fintech adoption rate of 87%, substantially higher than the world average of 64% as per the latest Global FinTech Adoption Index.
- The number of neo-banking platforms and global investments in the neo-banking segment has also risen consistently. The growth of these institutions is spurred by the need for on-demand and easier-to-access financial solutions by a young and increasingly digitally savvy demographic.
- Issuance of CBDC (Central Bank Digital Currency) in India offers several benefits, which inter alia, include reduction in operational costs involved in physical cash management, fostering financial inclusion, bringing resilience, efficiency, and innovation in the payments system, boosting innovation in cross-border payments space, and providing public with uses that any private virtual currencies can provide, without the associated risks.
- Digitalising documents has also played a pivotal role in giving further impetus to digital financial services. The digitisation of documents ensures safety, online verification, improved accessibility, and fraud reduction, enhancing use for end customers and the service provider.
Outlook
India’s services sector growth which was highly volatile and fragile during the last two fiscal years, has shown resilience in FY23 driven by the release of pent-up demand, ease of mobility restriction, near-universal vaccination coverage and pre-emptive government interventions. The prospects look bright with improved performance of various sub-sectors like tourism, hotel, real estate, IT-BPM, e-commerce etc.
11. External Sector: Watchful and Hopeful
India’s external sector has been buffeted by shocks and uncertainty manifested in terms of elevated, though now easing global commodity prices; tightening international financial conditions; heightening financial market volatility; reversal of capital flows; currency depreciation, and looming global growth and trade slowdown. Even then, it has been able to face these headwinds from a position of strength on the back of strong macroeconomic fundamentals and buffers.
Trade Helping India Reap the Benefits of Globalised World
- Trade Growth: The global merchandise trade in value terms rose year-on-year (YoY), by 22.2% in 2021, reversing the deceleration observed in the previous three years. However, trade growth is likely to slow in the closing months of 2022 and into 2023 as the global economy continues to be buffeted by strong headwinds, according to the WTO Goods Trade Barometer and the UNCTAD’s Global Trade update.
- Trends in Merchandise Trade: Moderation in pace is observed in India’s merchandise export growth, in 2022. Owing to the rise in global crude oil prices, petroleum products continued to be the most exported commodity in FY22, followed by gems and jewellery, organic & inorganic chemicals, and drugs & pharmaceuticals.
- Trade in Services: India’s services exports recorded a growth of 23.5% over FY21 and 32.7% over FY22, respectively. Software and business services together constitute more than 60% of India’s total services exports and strong revenues in major information technology (IT) companies from various segments such as retail and consumer business; communications and media; healthcare; and banking, etc. boosted the growth in business services exports.
- Foreign Trade Policy: In the year 2022, India signed Free Trade Agreements (FTAs) with UAE and with Australia. The Export Preparedness Index has also been introduced to evaluate States’ potentials and capacities. It will guide all stakeholders towards strengthening the export ecosystem at both the national and sub-national levels.
- Initiatives to Enhance Trade: Various government initiatives like Interest Equalisation Scheme, Remission of Duties and Taxes on Exported Products (RoDTEP) scheme, Export Credit Guarantee, Krishi Udan Scheme, Trade Infrastructure for Export Scheme, One District One Product Initiative, etc., have been facilitating and encouraging exports.
- Global Trade Engagements: This era of globalisation has been accompanied by a proliferation of trade agreements and the emergence of competing trade blocs. India considers Regional Trading Arrangements (RTAs) as ‘building blocks’ towards the overall objective of trade liberalisation and as complementing the multilateral trading system.
Balance of Payments in Challenging Times
- The adverse global economic situation placed India’s Balance of Payments (BoP) under pressure in 2022.
- Current Account Balance
- India’s current account balance (CAB) recorded a deficit of 4.4% of GDP in Q2 FY23 in contrast to a deficit of 1.3% of GDP during the corresponding period of the previous year.
- The widening of the current account deficit (CAD) in the second quarter of FY23 was mainly on account of a higher merchandise trade deficit and an increase in net investment income outgo.
- For the period April-September 2022 (H1 FY23), India recorded a CAD of 3.3% of GDP on the back of an increase in the merchandise trade deficit, as compared with 0.2% in H1 FY22.
- Invisibles
- Net services receipts increased in H1 FY22, primarily on account of robust computer and business services receipts.
- A sharp rise in crude oil prices and the deprecation of the INR seem to have boosted remittance flows into India. India has the largest emigrant population and is the top remittance recipient country with remittances anticipated to reach a milestone of USD 100 billion in 2022 according to the World Bank.
- Net services exports and remittances contributed to the surplus on the invisible account, which cushioned the merchandise trade deficit.
- Capital Account Balance
- Foreign investment, consisting of Foreign Direct Investment (FDI) and foreign portfolio investment (FPI), is the largest component of the capital account.
- Computer Software and Hardware attracted the highest share of FDI equity inflow (23.4%) followed by Services (15.4%) and Trading (12.2%).
- In terms of FDI inflow, Singapore was the top investing country with a 37.0% share, followed by Mauritius (12.1%), UAE (11.0%), and the USA (10.0%).
- Foreign Exchange Reserves
- As the net financial inflows fell short of the CAD, there was a depletion of foreign exchange reserves on a BoP basis to the tune of USD 25.8 billion in H1 FY23 in contrast to an accretion of USD 63.1 billion in H1FY22.
- As of end-November 2022, India was the sixth largest foreign exchange reserves holder in the world according to data compiled by the IMF.
Exchange Rates Moving in Tandem with Global Developments
- The exchange rate of the Indian Rupee is market-determined as the RBI's intervention in the foreign exchange market is mainly to contain instances of excessive volatility.
- The Nominal Effective Exchange Rate (NEER) of the US dollar (27 economies) appreciated by 7.8% in the calendar year 2022, up to December, while the NEER of India (64 economies) depreciated by 4.8%.
- Further, the INR appreciated against select major currencies barring the US dollar. The average exchange rate of INR against the Pound Sterling appreciated by 6.7% in April -December 2022 over April - December 2021. This rate of appreciation was 14.5% with respect to the Japanese Yen and 6.4% against the Euro.
- Cross-country comparisons of exchange rate movements are often made on an inflation-adjusted basis or what is called in real effective terms, viz. the Real Effective Exchange Rate (REER). Even in real terms, the INR witnessed modest depreciation in the face of global spill overs.
International Investment Position
- The international investment position (IIP) is a statistical statement that shows at a point in time the value and composition of (a) financial assets of residents of an economy that are claims on non-residents and gold bullion held as reserve assets, and (b) liabilities of residents of an economy to non-residents.
- The difference between an economy’s external financial assets and liabilities is the economy’s net IIP, which may be positive or negative. The Net IIP position determines whether a country is a net creditor or debtor nation by measuring the difference in its external assets and liabilities. These statistics serve as an indicator of a country’s financial condition and soundness.
- For India, as of end-September 2022, Indian residents’ overseas financial assets at USD 847.5 billion were lower by USD 73.0 billion or 7.9 per cent compared to the level as of end-March 2022. International liabilities at USD 1,237.1 billion as of end-September 2022 were lower by USD 41.6 billion (3.2 per cent) as compared to the level as of end-March 2022.
Safe and Sound External Debt Situation
- India’s external debt, at USD 610.5 billion as of end-September 2022, grew by 1.3 per cent (USD 7.6 billion) over USD 602.9 billion as of end-September 2021. However, external debt as a ratio to GDP fell to 19.2 per cent as of end-September 2022 from 20.3 per cent a year ago.
- The literature documents that the optimal threshold for India’s external debt is around 23-24 per cent of GDP. Thus, India has the potential growth positive space as far as the external debt level is concerned. While testifying to the prudent management of India’s external debt, this contrasts with the external debt distress unfolding in many peer countries, post-COVID-19.
- Comparing various debt vulnerability indicators of India with peer countries for 2021 informs that the country is in a better position in terms of relatively low levels of total debt as a percentage of Gross National Income (GNI) and short-term debt as a percentage of total debt. The current stock of external debt is well shielded by the comfortable level of foreign exchange reserves.
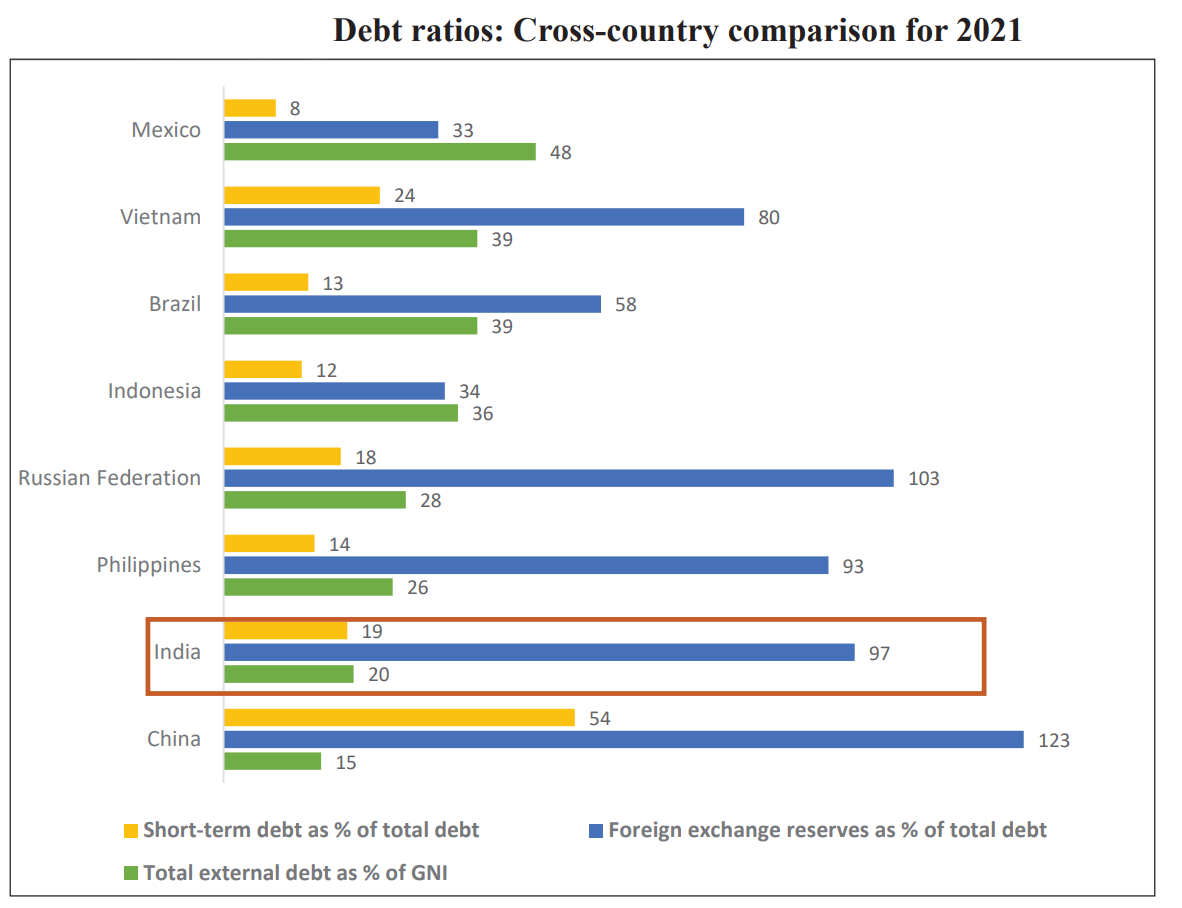
Outlook for the External Sector
- While recognising the potential adverse developments, it is important to take cognisance of innate buffers to India’s external sector.
- India is facing competition from South Asian countries in a few of its export competitive products. In the textile sector, Bangladesh is expanding its exports globally, Vietnam has been able to expand its exports in machinery and equipment; computers, electronic products, certain agriculture products etc. However, given the benefits of the lower average age of the working population along with the advantage of economies of scale, India has the potential to cater to the global demand for several products in a cost-effective manner.
- On the imports side, notwithstanding uncertainty surrounding the outlook on global crude oil prices, the recent softening in its prices augurs well for India’s POL imports. However, non-oil, non-gold imports, which are growth-sensitive, may not witness a significant slowdown as Indian growth continues to be resilient.
- To sum up, while India’s external sector faces challenges, it is performing relatively better as compared to many of its peers as it has inbuilt shock absorbers to weather them.
12. Physical and Digital Infrastructure: Lifting Potential Growth
The critical role played by infrastructure in economic growth cannot be overemphasised. Investing in high-quality infrastructure is crucial for accelerating economic growth and sustaining it in the long run.
Approaches to Infrastructure Development in India
- The outlay (target) for capital expenditure in 2022-23 (BE) was increased sharply by 35.4% from Rs. 5.5 lakh crore in the previous year (2021-22) to Rs. 7.5 lakh crore.
- PM GatiShakti, with a multimodal approach, is designed to fill the gaps in physical infrastructure and to integrate existing and proposed infrastructure development initiatives of different agencies.
- As India has already submitted its Long-Term Low Emission Development Strategy at COP27, the next leap would be towards advanced infrastructure, which is more energy efficient, incorporates the idea of a circular economy and transitions towards low carbon development.
Public-Private Partnerships (PPPs)
- In India, private participation in infrastructure programmes supports several PPP models, including management contracts like Build-Operate-Transfer (BOT), Design-Build-Finance-Operate-Transfer (DBFOT), Rehabilitate-Operate-Transfer (ROT), Hybrid Annuity Model (HAM), and Toll-Operate-Transfer (TOT) model.
- India Infrastructure Project Development Fund Scheme (IIPDF) was notified by the government in November 2022, with an aim to develop quality PPP projects by providing necessary funding support to the project-sponsoring authorities, both in the Central and State Governments, for creating a shelf of bankable, viable PPP projects by on-boarding transaction advisers.
National Infrastructure Pipeline (NIP)
- The government launched the National Infrastructure Pipeline (NIP) with an approach to provide high quality infrastructure across the country. It also envisages improving project preparation and attracting domestic and foreign investment in infrastructure.
- NIP is hosted on the Invest India Grid (IIG) platform and provides opportunities for States/UTs and Ministries to collate all major infrastructure projects at a single location. IIG thus acts as a centralised portal to track and review project progress across all economic and social infrastructure sub-sectors.
National Monetisation Pipeline
- The National Monetisation Pipeline (NMP) announced in August 2021 is based on the principle of ‘asset creation through monetisation.’
- The NMP provides an opportunity for deleveraging balance sheets and it taps private sector investment for new infrastructure creation providing fiscal space for investment in new infrastructure assets.
- The top 5 sectors (by estimated value) capture around 83% of the aggregate pipeline value: roads (27%) followed by railways (25%), power (15%), oil & gas pipelines (8%), and telecom (6%). Roads and railways together contribute around 52% of the total NMP value.
National Logistics Policy
- Logistics costs in India have been in the range of 14-18% of GDP against the global benchmark of 8%.
- National Logistics Policy was launched to improve efficiency in logistics through streamlining processes, regulatory framework, skill development, and mainstreaming logistics among others.
- The targets for achieving the vision of the NLP are to:
- Reduce the cost of logistics in India to be comparable to global benchmarks by 2030;
- Improve the Logistics Performance Index ranking - endeavour is to be among the top 25 countries by 2030, and
- Create a data driven decision support mechanism for an efficient logistics ecosystem.
- Key dimensions to be addressed to improve logistics for trade include:
- Ensuring efficiency of the clearance process (i.e., speed, simplicity, and predictability of formalities) by border control agencies, including customs;
- Improving the quality of trade and transport-related infrastructure (e.g., ports, railroads, roads, information technology);
- Easing of arranging competitively priced shipments;
- Enhancing the competence and quality of logistics services (e.g., transport operators, customs brokers);
- Providing for tracking and tracing of consignments and ensuring timeliness of shipments in reaching destinations within the scheduled or expected delivery time.
Developments in Physical Infrastructure Sectors
- Road Transport: Increased budgetary support by the government augmented road connectivity.
- There has been an increase in the construction of National Highways (NHs)/roads over time, with 10,457 km of roads constructed in FY22 as compared to 6,061 km in FY16.
- In line with the vision of monetisation of public sector assets, National Highways Authority of India (NHAI) launched its InvIT in FY22 not only to facilitate monetisation of roads but also to attract foreign and domestic institutional investors to invest in the roads sector.
- Railways: Expansion and modernisation, a continuous process.
- The Indian Railways (IR), with over 68,031 route kms, is the fourth largest network in the world under single management.
- The capital expenditure (Capex) on infrastructure in railways has seen a continuous increase in the last four years with Capex up by around 29%, compared to the previous year.
- Civil Aviation: Revival backed by domestic demand.
- The civil aviation sector in India has great potential owing to growing demand from the middle class, growth in population and tourism, higher disposable incomes, favourable demographics, and greater penetration of aviation infrastructure.
- This is further supported by the government through schemes such as UDAN, which has considerably enhanced regional connectivity through the opening of airports in India’s hinterland.
- Ports: Handling higher capacity with governance reforms.
- To meet the ever-increasing trade requirements, the expansion of port capacity has been accorded the highest priority by the government through the implementation of well-conceived infrastructure development projects.
- To further enhance their efficiency, the government is focusing on improving port governance, addressing low-capacity utilisation, modernising berths with techno efficient loading/unloading equipment, and creating new channels for port connectivity.
- Inland Water Transport: Tapping the potential of navigable waterways.
- India has a large endowment of rivers, canals, and other waterways, with a total navigable length of waterways of around 14,850 kilometres.
- Electricity: Installed capacity growth driven by renewables.
- The total installed power capacity of utilities and captive power plants (industries having demand of 1 Mega Watt (MW) and above) was up by 4.7% in 2022.
- Thermal sources of energy make up the largest (59.1%) share of total installed capacity in utilities, followed by renewable energy resources with 27.5% and hydro with 11.7%.
Developments in Digital Infrastructure
- The total telephone subscriber base in India stands at 117 crores. The overall tele-density in India stood at 84.8%, with wide differences across states.
- With a special focus on the states in the North-Eastern Region, the government is implementing a Comprehensive Telecom Development Plan (CTDP).
- Under CTDP for NER, mobile connectivity on 2G is to be provided by setting up 2004 towers in the uncovered villages and along National Highways of Assam, Manipur, Mizoram, Nagaland, Tripura, Sikkim, and Arunachal Pradesh (National Highways only).
- Universal and equitable access to broadband services across the country, especially in rural areas, is an important part of the government’s vision for national digital connectivity. Toward realising that vision, the GatiShakti Sanchar portal was launched in May 2022.
- The national AI portal has been developed with a view to strengthening the AI ecosystem in the country by pooling together and highlighting the latest developments happening in Central and State Governments, industry, academia, NGOs, and civil societies.
Conclusion
- The targeted increase in investment is seen across all infrastructure sectors. To help sustain the investment drive, NIP provided a forward-looking roadmap of investible projects. Further, PM GatiShakti has helped accelerate infrastructure development by integrating the seven engines (roads, railways, airports, ports, mass transport, waterways, and logistic infrastructure) of growth. The synergy between physical and digital infrastructure will be one of the defining features of India's future growth story.


