Indian Economy
Recalibrating New Consumption Survey
- 12 Mar 2024
- 20 min read
This editorial is based on “Moving to a Better Count” which was published in Indian Express on 12/03/2024. The article discusses the All India Household Consumption Expenditure Survey (HCES) conducted by the Ministry of Statistics and Program Implementation (MoSPI) from August 2022 to July 2023, exploring its different facets.
For Prelims: Household Consumption Expenditure Survey (HCES), National Statistical Office (NSO), Gross Domestic Product (GDP), Consumer Price Inflation (CPI), NITI Aayog, Monthly Per Capita Consumer Expenditure, C. Rangarajan Committee, Tendulkar Committee
For Mains: Highlights of the Household Consumption Expenditure Survey 2022-23.
Recently, summary results of the Household Consumption Expenditure Survey (HCES), 2022-23, conducted by the National Sample Survey Office (NSSO) were released, which demand analysis of three issues related to identified trends in poverty- difference between private consumption expenditure of NSSO and the figure provided by the National Accounts Statistics (NAS); and changes in consumption patterns and implications for consumer price index (CPI) and monetary policy.
What are the Highlights of the Recent HCES?
- About:
- The HCES is usually conducted by the National Statistical Office (NSO) every 5 years.
- It is designed to collect information on the consumption of goods and services by households.
- The data collected in HCES is also utilized for deriving various other macroeconomic indicators such as Gross Domestic Product (GDP), poverty rates, and CPI.
- NITI Aayog has stated that the latest consumer expenditure survey indicated that poverty has come down to 5% in the country.
- The findings of the last HCES, conducted in 2017-18 were not released after the government cited “data quality” issues.
- Information Generated:
- Provides information on the typical spending on both goods (including food and non-food items) and services.
- Additionally, assists in calculating estimates for household Monthly Per Capita Consumer Expenditure (MPCE) and analyzing the distribution of households and individuals across different MPCE categories.
- Highlights of the Recent Survey: The estimates of average monthly per capita consumption expenditure were generated without imputing the value figures of the items received free by the households through various social welfare programmes such as Pradhan Mantri Garib Kalyan Yojana.
- Increase in MPCE:
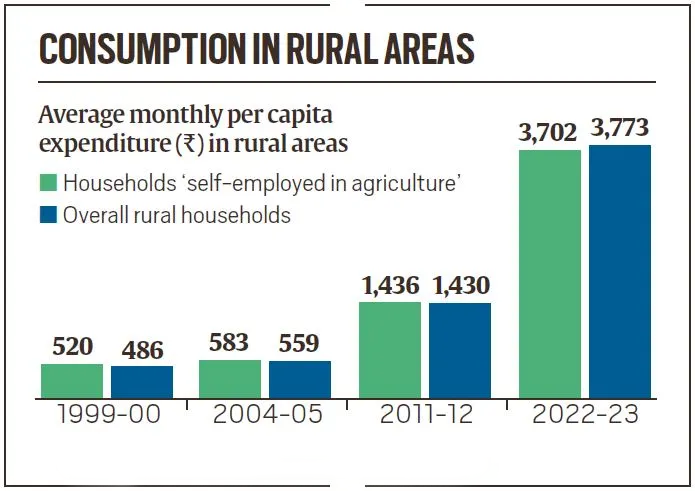
- It reveals a 33.5% increase in MPCE in urban households since 2011-12, reaching ₹3,510, while rural India's MPCE increased by 40.42% to ₹2,008.
- In 2022-23, 46% of rural household expenditure and 39% of urban household expenditure were on food items.
- Distribution of MPCE by Population Percentiles:
- The bottom 5% of India’s rural population, ranked by MPCE, has an average MPCE of Rs. 1,373 while it is Rs. 2,001 for the same category of population in the urban areas.
- The top 5% of India’s rural and urban population, ranked by MPCE, has an average MPCE of Rs. 10,501 and Rs. 20,824, respectively.
- State-wise MPCE Variations:
- Sikkim has the highest MPCE in both rural (₹7,731) and urban areas (₹12,105), while Chhattisgarh has the lowest with ₹2,466 for rural households and ₹4,483 for urban households.
- The rural-urban difference in average MPCE, among the states is the highest in Meghalaya (83%) followed by Chhattisgarh (82%).
- UT-wise MPCE Variations:
- Among the UTs, MPCE is the highest in Chandigarh (Rural Rs. 7,467 and Urban Rs. 12,575), whereas, it is the lowest in Ladakh (Rs. 4,035) and Lakshadweep (Rs. 5,475) for rural and urban areas respectively.
- Food Spending Trends:
- Since the 1999-2000 survey, the share of expenditure on food has gradually declined and the share of non-food items has increased for both urban and rural households.
- A decline in food spending is understood as an increase in incomes, which then means having more money for other expenditures like on medical, clothing, education, conveyance, durables, fuel, entertainment, among other things.
- The recent survey result showed that the share of cereals and pulses within overall food consumption expenditure has been reducing, both in rural and urban households.
- Among the non-food items, the share of spending on conveyance was the highest.
- Till 2022-23, fuel and light used to see the highest consumption spending among the non-food items.
- Changes in the Methodology Over The Previous Survey:
- The HCES 2022-23 has undergone some changes as compared to the previous surveys in consumption expenditure. These are:
- Item coverage;
- Changes in the questionnaire;
- Multiple visits for data collection and computed assisted personal interviews compared to pen and paper interviews.
- The HCES 2022-23 has undergone some changes as compared to the previous surveys in consumption expenditure. These are:
- Increase in MPCE:

What are the Three Different Issues Related to Identified Trends in Estimating Poverty?
- Changes in Consumption Patterns as Provided by NSSO and NAS:
- The first issue is to examine the changes in poverty using the new information on consumption expenditure:
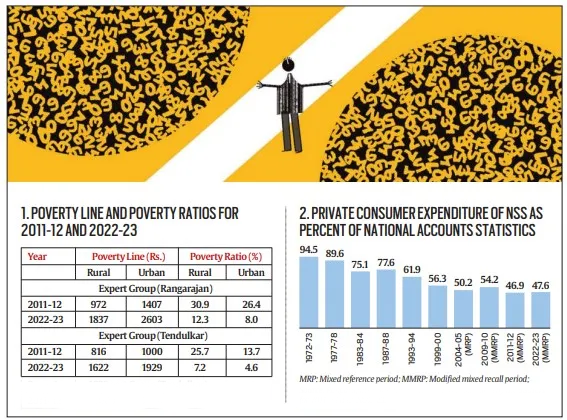
- The poverty lines for 2011-12 based on Expert Group (Tendulkar) Methodology were Rs 816 and Rs 1,000 per capita per month respectively for rural and urban areas.
- An SBI report has estimated poverty ratios in 2022-23 by updating poverty lines. The new updated poverty line is Rs 1,622 in rural areas and Rs 1,929 in urban areas.
- According to this SBI report, poverty in rural areas declined from 25.7% in 2011-12 to 7.2% in 2022-23 while in urban areas it declined from 13.7% to 4.6%. Using the shares of the rural and urban populations, the total poverty ratio based on the Tendulkar committee methodology comes to 6.3%.
- The poverty line for 2011-12 based on Expert Group (Rangarajan) Methodology was Rs 972 and Rs 1,407 per capita per month respectively for rural and urban areas.
- Using CPI, the poverty line was updated, which is Rs 1,837 for rural and Rs 2,603 for urban areas in 2022-23. The poverty ratio for rural areas declined from 30.9% in 2011-12 to 12.3% in 2022-23.
- For urban areas, it declined from 26.4% in 2011-12 to 8% in 2022-23. It may be noted that the poverty ratio derived from the Expert Group (Rangarajan) method is 71% higher in rural areas and 74% higher in urban areas than that derived by using the Expert Group (Tendulkar) method.
- The overall poverty ratio under the Rangarajan methodology for 2022-23 will be 10.8%. While the poverty ratio is higher under this methodology, the order of decline in percentage points between the two periods is the same under both methodologies in rural areas. But in urban areas, the decline in this methodology is higher.
- The poverty lines for 2011-12 based on Expert Group (Tendulkar) Methodology were Rs 816 and Rs 1,000 per capita per month respectively for rural and urban areas.
- However, as mentioned above, the data on consumption expenditure in 2022-23 is not strictly comparable to earlier surveys. The comparable data would have probably given much higher poverty figures under the Rangarajan Committee methodology, particularly for urban areas.
- The first issue is to examine the changes in poverty using the new information on consumption expenditure:
- Difference Between the Aggregate Private Consumption Expenditure given by the NSSO and NAS:
- The second issue is the alarming difference between the aggregate private consumption expenditure given by the NSSO and the figure provided by the NAS:
- What is disturbing is that despite substantial methodological changes to capture private expenditure, the NSSO share increased only marginally in 2022-23.
- However, these two estimates of consumption (NSSO and NAS) do not match in any country; India is no exception.
- What is perplexing is that the difference in India between the NSS and the NAS consumption is widening over time. From a difference of less than 10% in the late 1970s, it has come to 53% in 2011-12.
- This difference declined only marginally to 52% in 2022-23. However, with the continuation of differences of more than 50%, the time has come for a deeper analysis of the factors contributing to the difference. Such a large difference has implications for computing the poverty ratio.
- What is disturbing is that despite substantial methodological changes to capture private expenditure, the NSSO share increased only marginally in 2022-23.
- The second issue is the alarming difference between the aggregate private consumption expenditure given by the NSSO and the figure provided by the NAS:
- Implications of the HCES 2022-23 for the Consumer Price Index (CPI):
- The third issue is the implications of the HCES 2022-23 for the CPI. The latest data reveal that there have been some changes in consumption patterns between 2011-12 and 2022-23.
- In rural areas, the share of food in monthly per capita expenditure (MPCE) has declined from 52.9% in 2011-12 to 46.4% in 2022-23 — a decline of 6.5 percentage points in 11 years.
- In urban areas, the share of food in total consumption decreased from 42.6% to 39.2% during the same period — a decline of 3.5 percentage points in 11 years.
- The share of cereals in average MPCE has shown a significant decline in rural areas, from 10.8% in 2011-12 to 4.9% in 2022-23 and 6.7% to 3.6% in urban areas.
- In food items, the share of fruits, beverages and processed food rose both in rural and urban areas. There is some reduction in the share of vegetables.
- In non-food items, the shares of toiletries and household items, conveyance and durable goods increased significantly in both rural and urban areas.
- Implications for the Weights of Food and Non-Food Items in the CPI and Inflation:
- This new data can help adjust weights in the CPI basket which is currently based on 2011-12 weights. The decline in the weights of food items is a good sign, as food prices are volatile and many times higher than those of non-food items.
- However, the question is whether the present decline in food share is enough to have a significant impact on inflation levels.
- The food share is still high at 46% and 39% respectively in rural and urban areas. The share of cereals, vegetables and edible oils declined but the share of fruits has increased, while the share of egg, fish and meat remains the same.
- However, a decline in food share will have some impact on inflation. The monetary policy committee will have to work with a new price index.
- This new data can help adjust weights in the CPI basket which is currently based on 2011-12 weights. The decline in the weights of food items is a good sign, as food prices are volatile and many times higher than those of non-food items.
- The third issue is the implications of the HCES 2022-23 for the CPI. The latest data reveal that there have been some changes in consumption patterns between 2011-12 and 2022-23.
What are the Suggestions Required to Make HCES Data More Robust and Indicative?
- Ensuring Uniform Representation of All Groups:
- In HCES 2022-23, the sampling methodology has undergone significant change, including stratum and second-stage stratum. The ‘rural’ stratum for HCES 2022-23 consists of just two strata, the first, comprising of the villages within a distance of 5 kilometres from the district headquarters and the rest are in the other strata. The ‘urban’ strata are classified based on ‘population’ as well as ‘affluence’ status.
- Sampling should be done to ensure proper representation of households of different economic categories, as there seems to be a higher representation of the well-off groups in the HCES 2022-23 sampling approach, thereby resulting in higher consumption expenditure and doing away with the ground reality.
- In HCES 2022-23, the sampling methodology has undergone significant change, including stratum and second-stage stratum. The ‘rural’ stratum for HCES 2022-23 consists of just two strata, the first, comprising of the villages within a distance of 5 kilometres from the district headquarters and the rest are in the other strata. The ‘urban’ strata are classified based on ‘population’ as well as ‘affluence’ status.
- Synchronising Reality With Labour Market Conditions:
- The claim of the NITI Aayog on growth being inclusive and broad-based with shrinking inequality – at the same time dismissing rural economic distress – must also be taken into perspective with the labour market outcomes. The number of working poor and the decline in real wages indicate the need for interrogating the labour market conditions in India before jumping to the conclusion that India has been able to end its poverty.
- Segregating the Debts and Savings in the Survey:
- Any durable or non-durable taken on bank loans, equal monthly installments (EMIs), or Kisan Credit Cards would eventually form part of consumption but will also add to the debt of the households.
- NAS clearly states that household consumption share has been dropping since 2016, and household debt is increasing; at the same time, savings as a share of GDP have fallen under the current government. Therefore, the debts extended should not be included in measuring the consumption data of familities.
- Avoiding Over-Reliance on Food Consumption Expenditure Data:
- It is well understood concept in economics that with economic growth and progress, the share of food consumption expenditure in the total household expenditure is bound to come down. Food expenditure in total expenditure in rural households has come down from 52.90% in 2011-12 to 46.38% in 2022-23, and for urban households from 42.62% in 2011-12 to 39.17%. This must be taken cautiously when it comes to indicating ic preconomogress.
- Food as share of total consumer expenditure is just 6.4% for USA (2018), 6.9% for Singapore (2018), 7.9% for United Kingdom (2019) and 8.9% for Switzerland (2019).
- Our shares of food expenditure with respect to other developed countries remains high, and we have a long way till we reach the level of consumption expenditure of USA and Switzerland. The HCES 2022-23 is being read to mean what cannot be found in it, nor inferred from it either.
- It is well understood concept in economics that with economic growth and progress, the share of food consumption expenditure in the total household expenditure is bound to come down. Food expenditure in total expenditure in rural households has come down from 52.90% in 2011-12 to 46.38% in 2022-23, and for urban households from 42.62% in 2011-12 to 39.17%. This must be taken cautiously when it comes to indicating ic preconomogress.
Conclusion
The release of the HCES, 2022-23, by the NSSO has brought attention to several crucial issues. Firstly, the survey highlights significant declines in poverty rates, especially in rural areas, when compared to earlier estimates using different methodologies. Secondly, the widening gap between private consumption expenditure estimates from NSSO and NAS raises concerns and calls for a deeper analysis to reconcile these figures. Finally, the changing consumption patterns, with a noticeable shift away from food items, have implications for the CPI and inflation calculations, necessitating adjustments in the CPI basket. Overall, these findings underscore the importance of accurately capturing consumption data and its implications for policy-making and economic analysis.
|
Drishti Mains Question How does the Household Consumer Expenditure Survey (HCES) impact policy formulation and economic planning in India? Discuss with examples. |
UPSC Civil Services Examination, Previous Year Question:
Q1. As per the NSSO 70th Round “Situation Assessment Survey of Agricultural Households”, consider the following statements: (2018)
- Rajasthan has the highest percentage share of agricultural households among its rural households.
- Out of the total agricultural households in the country, a little over 60 percent belong to OBCs.
- In Kerala, a little over 60 percent of agricultural households reported to have received maximum income from sources other than agricultural activities.
Which of the statements given above is/are correct?
(a) 2 and 3 only
(b) 2 only
(c) 1 and 3 only
(d) 1, 2 and 3
Ans: c
Q2. In a given year in India, official poverty lines are higher in some States than in others because (2019)
(a) poverty rates vary from State to State
(b) price levels vary from State to State
(c) Gross State Product varies from State to State
(d) quality of public distribution varies from State to State
Ans: (b)


