Indian Economy
Household Consumption Expenditure Survey 2022-23
- 05 Mar 2024
- 6 min read
For Prelims: Household Consumption Expenditure Survey, National Statistical Office, Gross Domestic Product, Consumer Price Inflation, NITI Aayog, Monthly Per Capita Consumer Expenditure, C. Rangarajan Committee.
For Mains: Highlights of the Recent Household Consumption Expenditure Survey
Why in News?
Recently, the Ministry of Statistics and Program Implementation disclosed the general results of the All India Household Consumption Expenditure Survey conducted from August 2022 to July 2023.
What are the Highlights of the Recent Household Consumption Expenditure Survey?
- About: The Household Consumption Expenditure Survey (HCES) is conducted by the National Statistical Office (NSO) every 5 years.
- It is designed to collect information on the consumption of goods and services by households.
- The data collected in HCES is also utilized for deriving various other macroeconomic indicators such as Gross Domestic Product (GDP), poverty rates, and Consumer Price Inflation (CPI).
- NITI Aayog has stated that the latest consumer expenditure survey indicated that poverty has come down to 5% in the country.
- The findings of the last HCES, conducted in 2017-18 were not released after the government cited “data quality” issues.
- Information Generated: Provides information on the typical spending on both goods (including food and non-food items) and services.
- Additionally, assists in calculating estimates for household Monthly Per Capita Consumer Expenditure (MPCE) and analyzing the distribution of households and individuals across different MPCE categories.
- Highlights of the Recent Survey: The estimates of average monthly per capita consumption expenditure were generated without imputing the value figures of the items received free by the households through various social welfare programmes such as Pradhan Mantri Garib Kalyan Yojana.
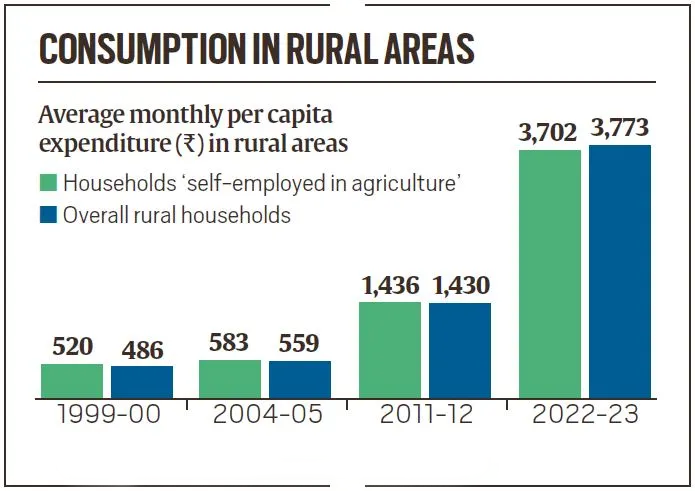
- Increase in MPCE: It reveals a 33.5% increase in MPCE in urban households since 2011-12, reaching ₹3,510, while rural India's MPCE increased by 40.42% to ₹2,008.
- In 2022-23, 46% of rural household expenditure and 39% of urban household expenditure were on food items.

- In 2022-23, 46% of rural household expenditure and 39% of urban household expenditure were on food items.
- Distribution of MPCE by Population Percentiles: The bottom 5% of India’s rural population, ranked by MPCE, has an average MPCE of Rs. 1,373 while it is Rs. 2,001 for the same category of population in the urban areas.
- The top 5% of India’s rural and urban population, ranked by MPCE, has an average MPCE of Rs. 10,501 and Rs. 20,824, respectively.
- State-wise MPCE Variations: Sikkim has the highest MPCE in both rural (₹7,731) and urban areas (₹12,105), while Chhattisgarh has the lowest with ₹2,466 for rural households and ₹4,483 for urban households.
- The rural-urban difference in average MPCE, among the states is the highest in Meghalaya (83%) followed by Chhattisgarh (82%).
- UT-wise MPCE Variations: Among the UTs, MPCE is the highest in Chandigarh (Rural Rs. 7,467 and Urban Rs. 12,575), whereas, it is the lowest in Ladakh (Rs. 4,035) and Lakshadweep (Rs. 5,475) for rural and urban areas respectively.
- Food Spending Trends: Since the 1999-2000 survey, the share of expenditure on food has gradually declined and the share of non-food items has increased for both urban and rural households.
- A decline in food spending is understood as an increase in incomes, which then means having more money for other expenditures like on medical, clothing, education, conveyance, durables, fuel, entertainment, among other things.
- The recent survey result showed that the share of cereals and pulses within overall food consumption expenditure has been reducing, both in rural and urban households.
- Among the non-food items, the share of spending on conveyance was the highest.
- Till 2022-23, fuel and light used to see the highest consumption spending among the non-food items.
- Increase in MPCE: It reveals a 33.5% increase in MPCE in urban households since 2011-12, reaching ₹3,510, while rural India's MPCE increased by 40.42% to ₹2,008.
What is the National Statistical Office?
- About: Formed in 2019 by merging the Central Statistical Office (CSO) and the National Sample Survey Office (NSSO).
- C. Rangarajan Committee first suggested the establishment of NSO as the nodal body for all core statistical activities.
- It currently works under the Ministry of Statistics and Programme Implementation (MoSPI).
- Function: Collects, compiles, and disseminates reliable, objective, and relevant statistical data.
UPSC Civil Services Examination, Previous Year Question:
Q. As per the NSSO 70th Round “Situation Assessment Survey of Agricultural Households”, consider the following statements: (2018)
- Rajasthan has the highest percentage share of agricultural households among its rural households.
- Out of the total agricultural households in the country, a little over 60 percent belong to OBCs.
- In Kerala, a little over 60 percent of agricultural households reported to have received maximum income from sources other than agricultural activities.
Which of the statements given above is/are correct?
(a) 2 and 3 only
(b) 2 only
(c) 1 and 3 only
(d) 1, 2 and 3
Ans: c
2. In a given year in India, official poverty lines are higher in some States than in others because (2019)
(a) poverty rates vary from State to State
(b) price levels vary from State to State
(c) Gross State Product varies from State to State
(d) quality of public distribution varies from State to State
Ans: (b)


