India's Top 1% Grew its Wealth by 62% Since 2000: G20 Report | 10 Nov 2025
For Prelims: G20, G7, Inequality, Malnutrition, Intellectual Property (IP), IPCC, Global Minimum Corporate Tax, IMF, Special Drawing Rights (SDRs), Food Security, Digital Divide.
For Mains: Findings of the G20 Report on Global Wealth Inequality, Key Drivers of inequality and its Socio-economic and Political Consequences. Measures Needed to Tackle Inequality.
Why in News?
The G20 Committee set up by the South African G20 Presidency, found that the world’s richest 1% accumulated 41% of global wealth between 2000 and 2023.
What are the Key Findings of the G20 Report on Global Inequality?
- Global Income Inequality: 83% of countries have high income inequality (Gini coefficient > 0.4). These countries account for 90% of the world’s population.
- Since 2000, global gaps have slightly narrowed due to growth in China and India, but major disparities persist—especially between rich regions and Sub-Saharan Africa—with a Gini coefficient of 0.61.
- Wealth Inequality: Between 2000 and 2024, global wealth inequality surged, with the richest 1% capturing 41% of new wealth, while the bottom 50% received just 1%.
- In India, the richest 1% grew their wealth share by 62% between 2000 and 2023.
- Global Food Insecurity: Globally, 1 in 4 people (2.3 billion) face moderate or severe food insecurity, with 335 million more regularly skipping meals since 2019.
Gini Index
- About Gini Index: The Gini index, developed in 1912 by Italian statistician Corrado Gini, measures income inequality within a population.
- It is derived from the Lorenz curve and quantifies the area between the curve and the line of perfect equality, ranging from 0 (perfect equality) to 1 (maximum inequality), with lower values indicating a more equitable society.
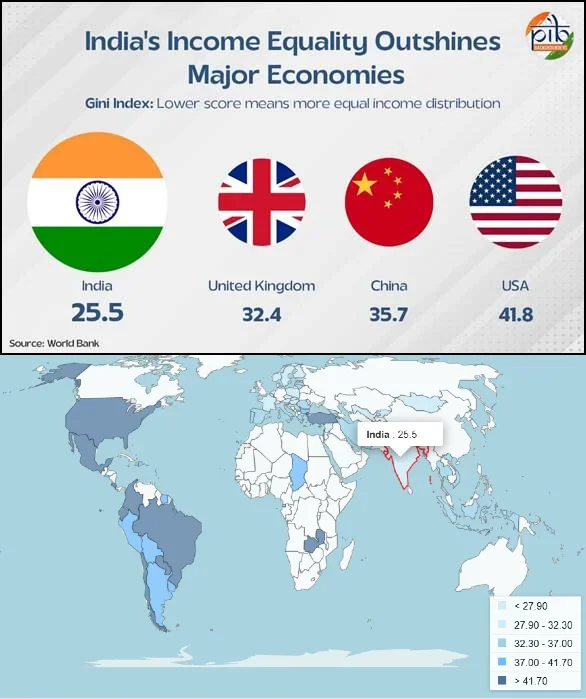
- India’s Gini Index Trends: India’s Gini coefficient declined from 28.8 in 2011 to 25.5 in 2022, placing it in the moderately low inequality category.
- India’s score of 25.5 positions it ahead of higher-inequality countries such as China (35.7) and the United States (41.8).
What are the Key Factors Driving Global Inequality?
- Economic Liberalisation: Financial deregulation (price volatility), labour market deregulation with weakened trade unions, and privatisation of public services disproportionately impact the poor, widening income and economic inequality.
- International Factors: Trade patterns and capital flows generate disproportionate income gains for corporate elites, while real wages for workers—especially the less skilled—remain suppressed; meanwhile, IP regimes and monopolies benefit developed countries and restrict access to essential health and technology.
- International tax rules and external shocks allow MNCs and elites to avoid fair taxation and expose developing countries to financial crises and global recessions.
- Structural Factors: Colonial legacies of extraction-based economies, unequal land ownership, and social discrimination, combined with industrial revolution-driven regional growth and intergenerational wealth transfer, have perpetuated economic inequality today.
- Unequal Distribution of Incomes: Unequal asset ownership and gaps in skills, education, and social capital boost income for some while leaving others behind.
- Social and Cultural Factors: Inheritance and marriage patterns, social discrimination (gender, caste, race), and weak public support perpetuate elite wealth and trap low-income populations in poverty.
What are the Various Implications of Inequality?
- Perpetuation of Poverty: High inequality creates poverty traps, limiting access to education, healthcare, and nutrition, and perpetuating intergenerational disadvantage. It also wastes human potential, reducing workforce productivity and innovation, and hindering overall economic growth.
- Economic Instability: Concentrated wealth drives speculation in financial assets and real estate over productive investments, while limited consumer demand from the majority slows economic growth.
- Health Crises: Out-of-pocket health spending has pushed 1.3 billion people into poverty, reducing productivity and earnings, while food insecurity affects 2.3 billion, causing hunger, malnutrition, and impaired cognitive and societal health.
- Erosion of Democracy: Extreme wealth concentration grants elites political influence and rule of law capture, making countries with high inequality seven times more likely to face democratic decline as trust in institutions erodes.
- Interconnected Vicious Cycle: These consequences form a vicious cycle: economic inequality fuels political inequality, leading to policies favoring the wealthy, which further increases economic inequality and weakens the middle class, causing political instability and slower economic growth.
What Recommendations Has the G20 Report Made to Tackle Inequality?
- Establish International Panel on Inequality (IPI),: The report recommends creating an IPI, modeled on the IPCC, to monitor global inequality, provide data to policymakers, and guide government interventions.
- Progressive Taxation: Implement progressive income, wealth, and inheritance taxes and increase social spending on healthcare, education, and social protection to make an equitable society and reduce wealth concentration.
- Social Protection Policies: Strengthen workers’ power via collective bargaining, trade union protection, and minimum wages, and curb corporate monopolies through antitrust enforcement for fair wages and competition.
- Reforming Global Trade and IP Rules: Allow Intellectual Property (IP) waivers and compulsory licenses for critical health and climate technologies and promote fair trade and investment agreements that help developing countries advance up the value chain.
- Reforming Global Financial Systems: Introduce a robust global minimum corporate tax and explore a minimum tax on ultra-wealthy individuals, while reforming International Financial Institutions (IFIs) by replacing austerity mandates with growth-focused policies, and recognizing capital controls for macroeconomic stability.
- Expand Capacities of Developing Countries: Offer debt relief to over-indebted developing countries, allocate IMF Special Drawing Rights (SDRs) based on need (not quota), and secure climate finance for adaptation and loss, while enhancing food security and bridging the digital divide.
Conclusion
The G20 report underscores that global inequality has reached emergency levels, with the richest 1% capturing disproportionate wealth. Inequality fuels poverty, health crises, economic instability, and democratic erosion. Tackling it requires progressive taxation, social protection, global coordination, and reform of trade, IP, and financial systems to achieve inclusive and sustainable growth.
|
Drishti Mains Question: Examine the impact of economic liberalization, structural factors, and international trade rules on inequality in developing countries. |
Frequently Asked Questions (FAQs)
1. What is the share of global wealth held by the richest 1%?
Between 2000–2024, the richest 1% captured 41% of all new wealth, while the bottom 50% received only 1%, highlighting extreme inequality.
2. What is the Gini Index and how does India compare globally?
The Gini Index measures income inequality (0 = perfect equality, 1 = maximum inequality). India’s Gini declined from 28.8 in 2011 to 25.5 in 2022, making it more equal than China (35.7) and the US (41.8).
3. What is the key proposal of the 2025 G20 report to combat global inequality?
The flagship proposal is the establishment of an International Panel on Inequality (IPI), modelled on the IPCC, to provide authoritative data and policy analysis on inequality trends.
UPSC Civil Services Examination, Previous Year Question (PYQ)
Mains
Q. COVID-19 pandemic accelerated class inequalities and poverty in India. Comment. (2020)