India’s New GDP Series With Base Year 2022-23 | 03 Mar 2026
For Prelims: Gross Domestic Product, Gross Fixed Capital Formation, Private Final Consumption Expenditure, National Statistical Office, System of National Accounts 2008, Fiscal deficit
For Mains: Base Year Revision and Its Significance in National Income Accounting, Fiscal Consolidation and Nominal GDP Dynamics, Measuring Informal, Gig and Digital Economy
Source:IE
Why in News?
The Ministry of Statistics and Programme Implementation (MoSPI) released the New Series of Annual and Quarterly National Accounts Estimates with base year 2022–23 replacing the earlier 2011-12, marking a major update in the way the Gross Domestic Product (GDP) is measured.
Summary
- India has shifted the GDP base year to 2022–23, integrating improved data sources and refined methods such as double deflation and the SUT framework. Real GDP is projected at 7.6% in FY 2025–26, reflecting sustained growth and better sectoral coverage.
- The revised series lowers nominal GDP by 3–4%, tightening fiscal deficit and debt-to-GDP targets and making the $4-trillion goal more growth- and exchange-rate sensitive, while highlighting the need for reforms like PPI introduction and WPI revision.
What are the Key Highlights of the New GDP Series (Base Year 2022–23)?
- Real GDP Growth: Estimated to grow by 7.6% in Financial Year 2025-26 (revised upward from the 2011-12 base estimates).
- The economy showed sustained performance with 7.2% and 7.1% growth in Financial Years 2023-24 and 2024-25, respectively.
- Nominal GDP Growth: Witnessed a growth of 8.6% in Financial Year 2025-26.
- Nominal GDP previously registered at 11.0% and 9.7% growth rates during Financial Years 2023-24 and 2024-25.
- Quarterly Performance Drivers: The overall economic performance in Financial Year 2025-26 is primarily driven by robust real growth in the Second Quarter (8.4%) and Third Quarter (7.8%).
- Manufacturing Sector: Emerged as the major driver contributing to economic resilience for three consecutive financial years after rebasing, achieving double-digit growth rates in Financial Years 2023-24 and 2025-26.
- Secondary and Tertiary Sectors: Significantly boosted the economy by registering growth rates above 9.0% in the Financial Year 2025-26.
- Specific Services Sub-Sector: The ‘Trade, Repair, Hotels, Transport, Communication and Services related to Broadcasting, Storage’ sector attained a notable growth rate of 10.1% at constant prices in Financial Year 2025-26.
- Consumption and Investment: On the demand side, both Private Final Consumption Expenditure and Gross Fixed Capital Formation exhibited growth rates exceeding 7.0% in Financial Year 2025-26.
Why was the GDP Base Year Revised to 2022-23?
- Reflect a “Normal” Post-Pandemic Year: The year 2022–23 was chosen because it represents the most recent normal year after the disruptions caused by Covid-19.
- The years 2019–20 and 2020–21 were heavily distorted due to lockdowns, supply chain disruptions, and abnormal consumption and production patterns.
- Using 2022–23 as the base ensures that growth comparisons are anchored in a stable economic environment.
- Sectoral Coverage: Over the past decade, India’s economy has changed significantly.
- Renewable energy has expanded, digital and platform-based services have grown rapidly, the number of hired domestic workers has increased, and the gig economy has become more prominent.
- Consumption and investment patterns have evolved, while greater use of technology has boosted productivity across sectors.
- Rebasing allows GDP estimates to better capture the contribution of these emerging sectors and shifts in relative prices.
- Renewable energy has expanded, digital and platform-based services have grown rapidly, the number of hired domestic workers has increased, and the gig economy has become more prominent.
- Improved and High-Frequency Data Sources: The revised series incorporates several new and richer data sources, reducing reliance on proxies and outdated benchmarks.
- Earlier, household sector estimates were largely based on proxy indicators and growth rates between benchmark surveys.
- In the revised series, actual levels are derived from regular annual surveys such as Annual Survey of Unincorporated Sector Enterprises (ASUSE) and Periodic Labour Force Survey (PLFS) allowing for more accurate and timely measurement of the sector’s performance.
- Wider use of GST data for manufacturing and services, including state-level allocation and quarterly estimates.
- Data from the e-Vahan portal is used to estimate Private Final Consumption Expenditure (PFCE) on road transport services, improving the measurement of household consumption.
- Public Financial Management System (PFMS) data is used to compile and distribute central government accounts across states, allowing actual expenditure figures to be used at the First Revised Estimates stage instead of relying on Revised Estimates.
- Updated sector-specific studies in agriculture, fisheries, dairy, and transport. These additions improve granularity, timeliness, and reliability.
- Earlier, household sector estimates were largely based on proxy indicators and growth rates between benchmark surveys.
- Strengthen Methodological Rigor: The new base year accompanies important methodological upgrades:
- Refined Deflation Techniques: Double deflation (separate adjustment of output and input prices) is now applied in manufacturing and agriculture, while single extrapolation (estimating growth using a single output indicator) is used in other sectors.
- Single deflation has been discontinued. Deflators are applied at a more granular level, with over 260 item-level CPI indices incorporated.
- Supply and Use Table (SUT) Framework: Following System of National Accounts 2008 (SNA 2008) guidelines, the new GDP series systematically integrates the SUT framework and applies the product-balancing principle (total supply equals total use).
- This reduces statistical discrepancies and ensures more consistent and reliable GDP estimates.
- Segregation of Multi-Activity Corporations: Value added of multi-activity corporations is now distributed across activities using detailed corporate filings.
- Improved Estimation of PFCE: Estimation of Private Final Consumption Expenditure (PFCE) has also been strengthened through a mixed approach that combines household survey data, administrative records, the commodity flow method, and the updated Classification of Individual Consumption According to Purpose (COICOP) 2018.
- Refined Deflation Techniques: Double deflation (separate adjustment of output and input prices) is now applied in manufacturing and agriculture, while single extrapolation (estimating growth using a single output indicator) is used in other sectors.
- Strengthened GSDP Estimation: The revision of the GDP base year to 2022–23 also strengthens GSDP estimation.
- The National Statistical Office (NSO) under MoSPI ensures states follow uniform national accounting standards.
- With the new base, states will shift toward greater direct estimation, reduce reliance on fixed ratios and proxies, and better use state-level data, improving accuracy and comparability across states.
What are the Implications of the New GDP Series (Base Year 2022–23)?
- Contraction in Nominal GDP: The new statistical framework has reduced India's nominal GDP by roughly 3% to 4% for the 2025–26 financial year and the preceding three years.
- Pressure on Fiscal Deficit Targets: The fiscal deficit is calculated as a percentage of nominal GDP, a smaller nominal GDP mathematically inflates the deficit ratio for past and present years.
- The 2025–26 fiscal deficit target was initially set at 4.4% based on the old series. Applying the new, lowered nominal GDP pushes this ratio up to 4.5%.
- To achieve the targeted 4.3% fiscal deficit for the 2026-27 financial year, the economy will now require a massive nominal growth rate of 13% to 14%.
- This is notably higher than the 10% assumption outlined in the Union Budget 2026–27, indicating the government may need to aggressively recalibrate its borrowing strategies.
- Rising Debt-to-GDP Ratios: Reduced size of the economy negatively impacts the national debt-to-GDP ratio.
- The Centre’s debt ratio is estimated to rise from 56.2% to 58.1% for 2025–26 under the new series.
- Current calculations suggest that even if nominal growth successfully hits 10% in 2026–27, the ratio will hover around 57.5%, missing the government's target of 55.6%.
- Hurdles for the USD 4-Trillion Economy Goal: In 2025–26, India’s GDP stood at about USD 3.8 trillion.
- Crossing the USD 4-trillion mark in 2026–27 is still possible, but it leaves little room for error and requires at least 10% nominal growth.
- The target is also highly sensitive to the exchange rate, as any further rupee depreciation would make achieving it more difficult despite strong domestic growth.
- Sectoral Realignments: The agricultural sector is now estimated to be about 5% larger due to better capture of high-value crops and lower input costs, including increased use of solar power under schemes like PM KUSUM.
What Measures are Needed to Further Advance India’s Economic Measurement Framework?
- Introduce a Producer Price Index (PPI): India currently relies heavily on the Consumer Price Index (CPI) and Wholesale Price Index (WPI).
- As recommended by the Working Group chaired by Prof. B.N. Goldar (2014), introducing PPI will provide a much more accurate measure of the average change in selling prices received by domestic producers for their output, aligning India with global standards.
- Expedite the WPI Base Revision: While the CPI and IIP base years are being updated, the WPI base year revision must be completed swiftly to ensure that the deflators used across all sectors represent current market realities.
- Global Alignment: The UN Statistical Division is transitioning to SNA 2025 (expected to be adopted globally by 2029–30).
- India must proactively build the data infrastructure to adopt SNA 2025, which includes specialized guidelines for measuring the digital economy, crypto assets, and environmental/green accounting.
- Mitigating Large Firm Bias: Heavy reliance on Ministry of Corporate Affairs data may overstate large firms’ performance while underestimating MSMEs that do not file timely returns.
- Improved methods are needed to better capture the value added by smaller enterprises.
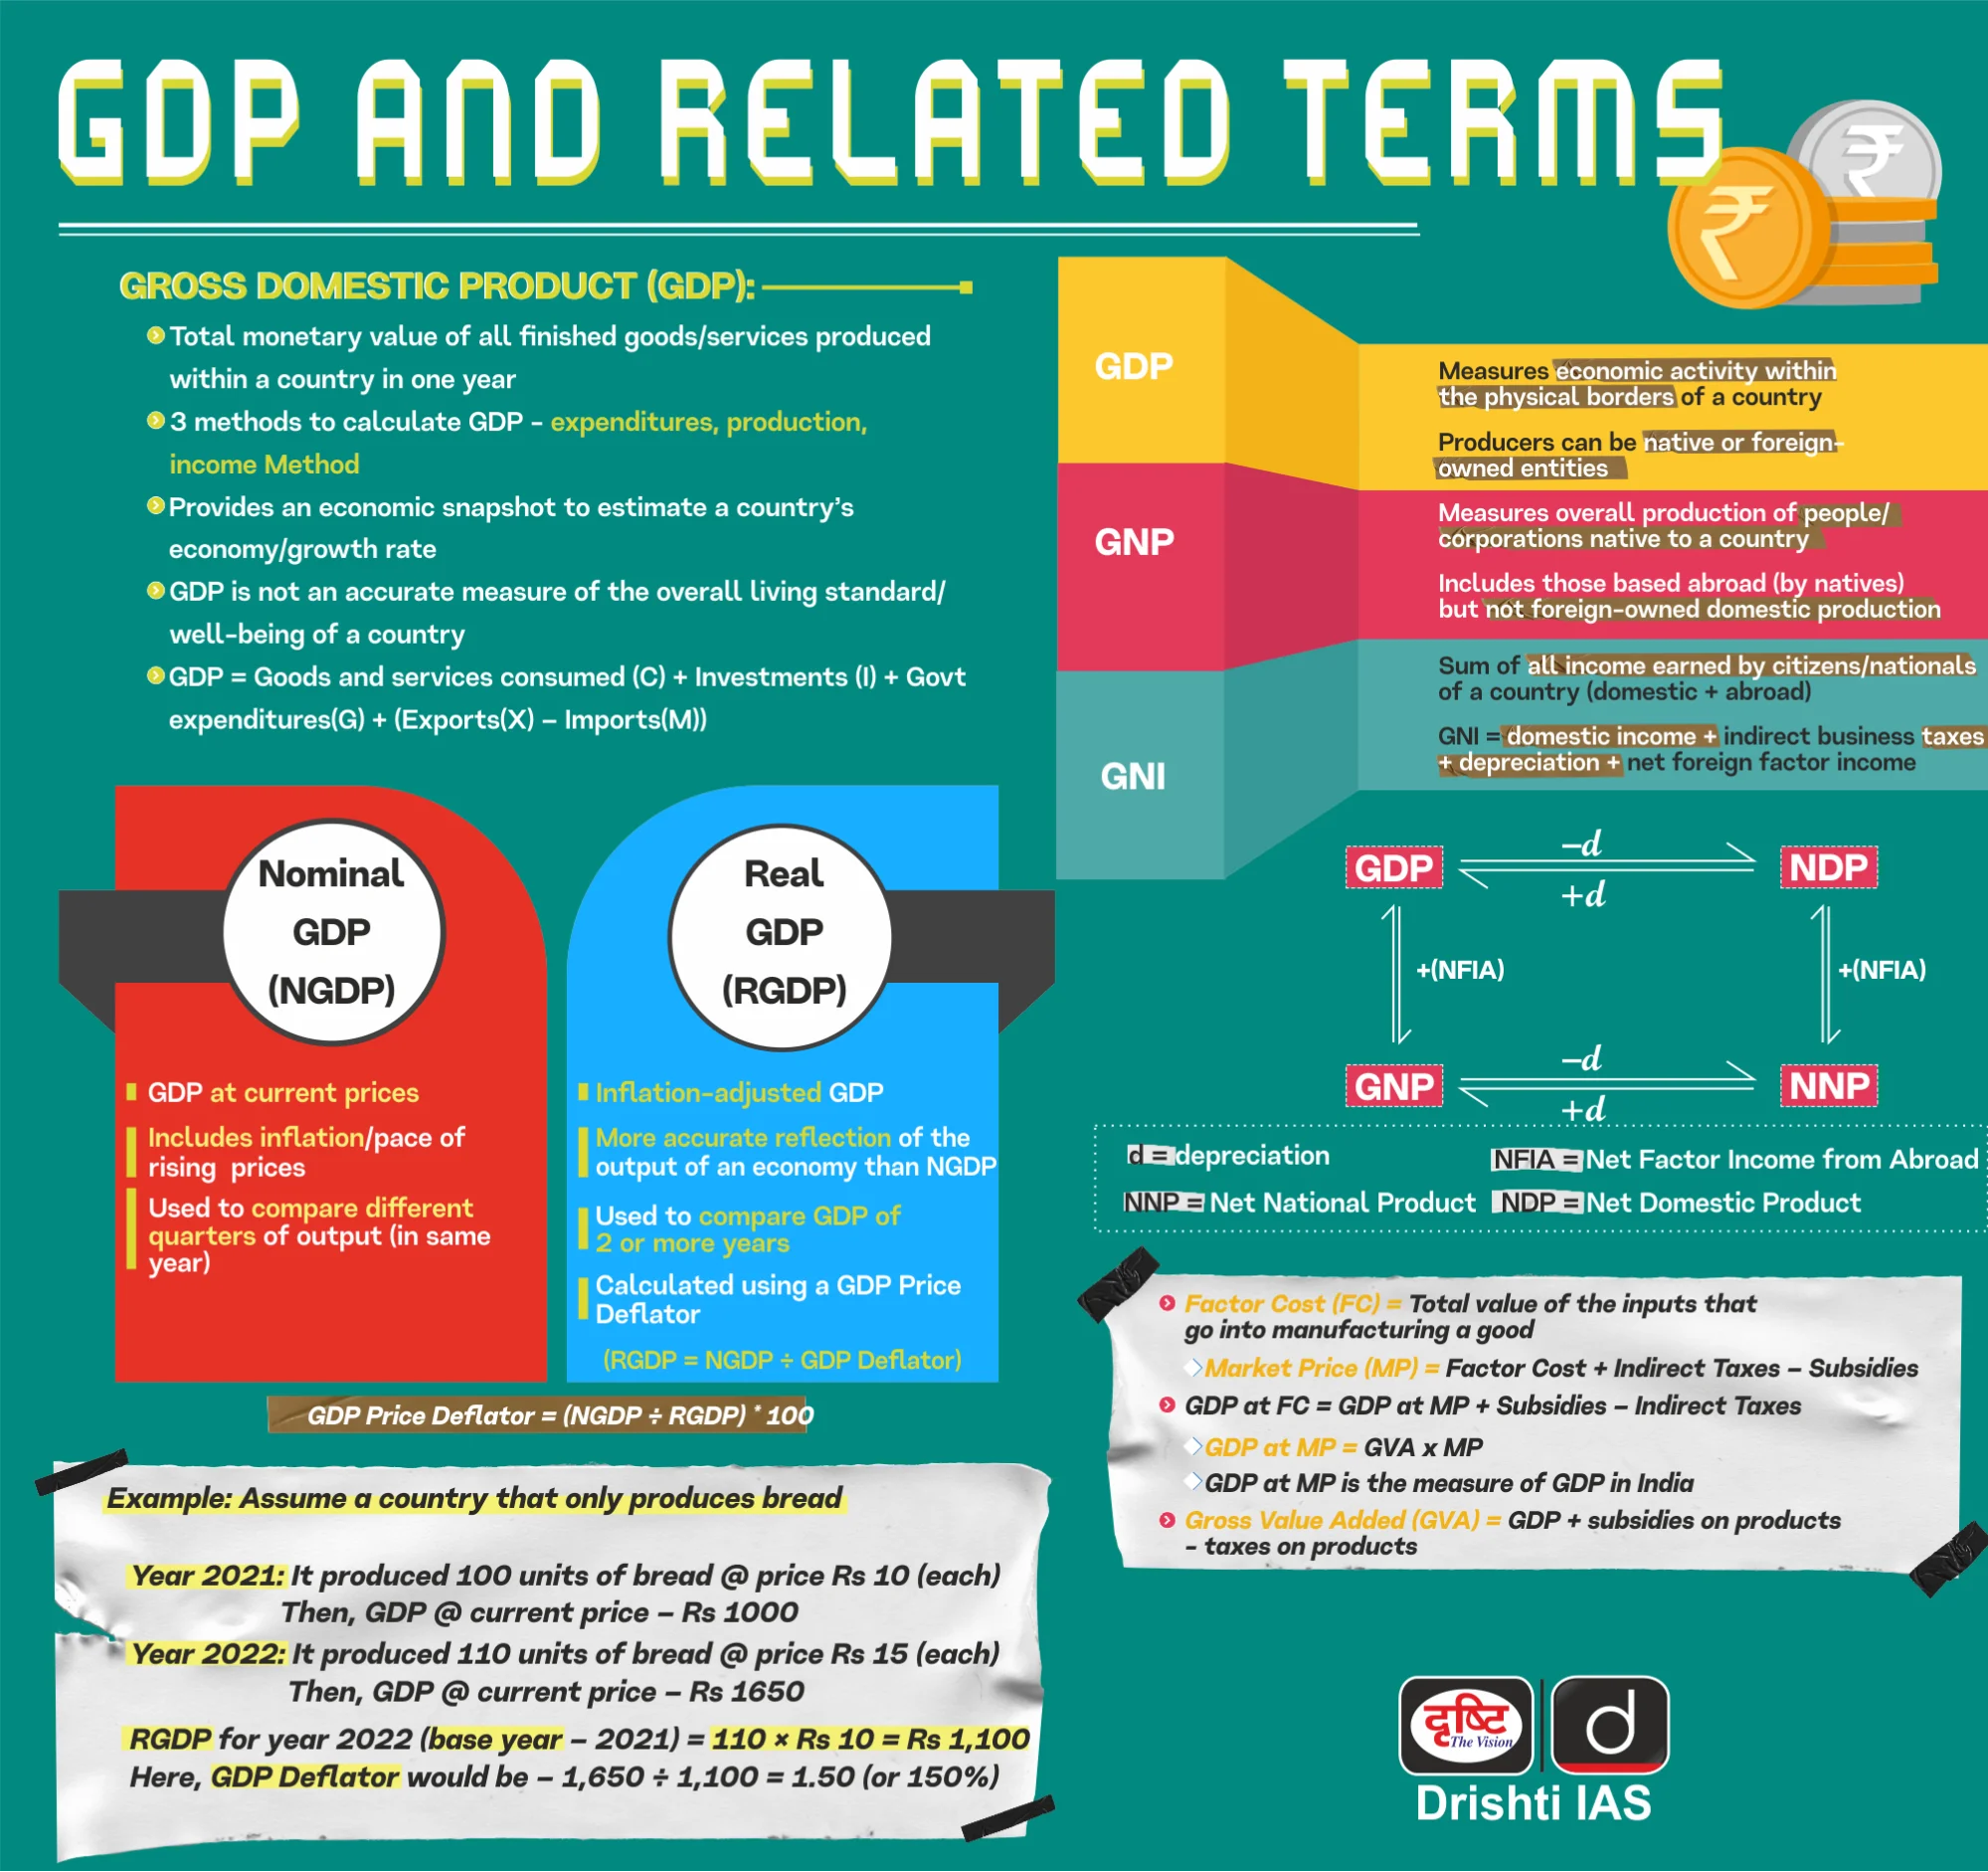
Glossary of Economic Terms
- GDP: It is the value of final goods and services produced within a country in an accounting period.
- By tracking changes in GDP over time, one can assess whether an economy is expanding or contracting and draw broad inferences about improvements in living standards.
- India compiles GDP in line with the System of National Accounts (SNA 2008) and plans to align with SNA 2025 in the next base year revision.
- As a subscriber to the IMF’s Special Data Dissemination Standard (SDDS), India follows global standards of statistical quality and transparency, and the revised GDP series remains internationally consistent.
- Quarterly GDP Estimates: National Statistical Office (NSO) & MoSPI calculate the quarterly GDP estimates using Benchmark-Indicator- a standard method used worldwide following the System of National Accounts (SNA) 2008 and IMF’s Quarterly National Accounts Manual 2017.
- The method works as follows:
- Annual GDP estimates act as a reference point/ benchmark.
- High-frequency data, like monthly or quarterly indicators, are applied to these benchmark estimates to estimate quarterly GDP.
- The method works as follows:
- Base Year: The base year, as defined in National Accounts Statistics, is the reference year whose prices are used to calculate real GDP growth and measure changes in economic performance over time.
- Rebasing: It is the process of updating the base year using improved data to reflect the current structure of the economy.
- The new base year becomes the reference point for estimating GDP and key indicators like CPI and IIP.
- GSDP: It is the value of all the goods and services produced within the boundaries of the State during a year.
- The NSO under MoSPI issues guidelines and provides technical support for estimating GSDP, while the Directorates of Economics and Statistics in each State and UT compile GSDP using state-level data drawn largely from common sources.
- COICOP: It is the United Nations-endorsed international reference classification of household expenditure.
- Supply and Use Tables (SUTs): The SUTs framework tracks how goods and services enter the economy through production or imports and how they are used for consumption, investment, or exports.
- By linking total supply with total use for each product, the SUT framework balances production, income, and expenditure approaches to GDP.
Conclusion
Real GDP growth of 7.6% in FY 2025–26 reflects strong economic momentum toward the vision of Viksit Bharat. The shift to the 2022–23 base year modernizes GDP measurement with better data and methods. Together, these reforms strengthen accuracy, transparency, and global credibility of India’s statistics.
|
Drishti Mains Question: Q. The revision of GDP base year is a technical exercise with significant fiscal consequences. Discuss in the context of India’s 2022–23 rebasing. |
Frequently Asked Questions (FAQs)
1. Why was the GDP base year revised to 2022–23?
To reflect a post-pandemic normal year, capture structural economic changes, integrate improved data sources, and align with global statistical standards under SNA 2008.
2. How does a lower nominal GDP affect fiscal deficit targets?
Since fiscal deficit is measured as a percentage of GDP, a lower nominal GDP mechanically increases the deficit ratio, tightening fiscal consolidation targets.
3. What is the significance of the Supply and Use Table (SUT) framework?
SUT ensures total supply equals total use, reconciling production and expenditure estimates and reducing statistical discrepancies in GDP.
4. What is Double Deflation and why is it important?
Double Deflation adjusts output and input prices separately, providing more accurate real value-added estimates, especially in manufacturing and agriculture.
5. How does the new GDP series impact India’s USD 4-trillion goal?
With GDP at $3.8 trillion in 2025–26, crossing USD 4 trillion is achievable but highly dependent on nominal growth and exchange rate stability.
UPSC Civil Services Examination, Previous Year Questions (PYQs)
Prelims
Q1. With reference to Indian economy, consider the following statements: (2015)
- The rate of growth of Real Gross Domestic Product has steadily increased in the last decade.
- The Gross Domestic Product at market prices (in rupees) has steadily increased in the last decade.
Which of the statements given above is/are correct?
(a) 1 only
(b) 2 only
(c) Both 1 and 2
(d) Neither 1 nor 2
Ans: (b)
Q2. A decrease in tax to GDP ratio of a country indicates which of the following? (2015)
- Slowing economic growth rate
- Less equitable distribution of national income
Select the correct answer using the code given below:
(a) 1 only
(b) 2 only
(c) Both 1 and 2
(d) Neither 1 nor 2
Ans: (a)
Mains
Q1. Define potential GDP and explain its determinants. What are the factors that have been inhibiting India from realizing its potential GDP? (2020)
Q2. Explain the difference between computing methodology of India’s Gross Domestic Product (GDP) before the year 2015 and after the year 2015. (2021)