Ease of Living & Municipal Performance Index 2020 | 05 Mar 2021
Why in News
Recently, the Ministry of Housing and Urban Affairs released the final rankings of Ease of Living Index (EoLI) 2020 and the Municipal Performance Index (MPI) 2020.
Key Points
- Municipal Performance Index:
- About:
- It has been launched as an accompaniment to the Ease of Living Index.
- It seeks to examine local government practices in municipalities across areas of services, finance, policy, technology and governance.
- It also seeks to simplify and evaluate the complexities in local governance practice and promote the ethos of transparency and accountability.
- Coverage:
- The MPI examined the sectoral performance of 111 municipalities (with Delhi being assessed separately for NDMC, and the three Municipal Corporations).
- Parameters Used:
- The five verticals under MPI are Services, Finance, Policy, Technology and Governance. These five verticals comprise 20 sectors and 100 indicators in all totality.
- Categories:
- The assessment framework under MPI 2020 has classified municipalities based on their population:
- Million+ (municipalities having over a million population) and
- Less than a Million Population.
- The assessment framework under MPI 2020 has classified municipalities based on their population:
- About:
- MPI 2020 Performance
- Million+ category:
- Indore has emerged as the highest ranked municipality, followed by Surat and Bhopal.
- Less than Million category:
- New Delhi Municipal Council topped, followed by Tirupati and Gandhinagar.
- Million+ category:
- Ease of Living Index
- About:
- It is an assessment tool that evaluates the quality of life and the impact of various initiatives for urban development.
- It provides a comprehensive understanding of participating cities across India based on quality of life, economic-ability of a city, and its sustainability and resilience.
- Aim:
- It aims to enable cities to systematically assess themselves against global and national benchmarks and encourage them to shift towards an ‘outcome-based’ approach to urban planning and management.
- Parameters:
- Citizen Perception:
- The EoLI 2020 strengthens its scope by consolidating the framework with the addition of a Citizen Perception Survey in the index, holding a weightage of 30%.
- Citizen Perception Survey:
- It was undertaken to help validate citizens' experience of their city in terms of service delivery.
- Bhubaneswar had the highest CPS score, followed by Silvassa, Davangere, Kakinada, Bilaspur and Bhagalpur.
- Citizen Perception Survey:
- The EoLI 2020 strengthens its scope by consolidating the framework with the addition of a Citizen Perception Survey in the index, holding a weightage of 30%.
- Existing Living Conditions:
- It also examines the outcomes that lead to existing living conditions.
- Across 13 categories such as Education, Health, Housing and Shelter, Buildings, Energy Consumption, and City Resilience, that account for 70% of the overall outcome.
- Citizen Perception:
- About:
- EoLI Performance 2020
- Million+ Category:
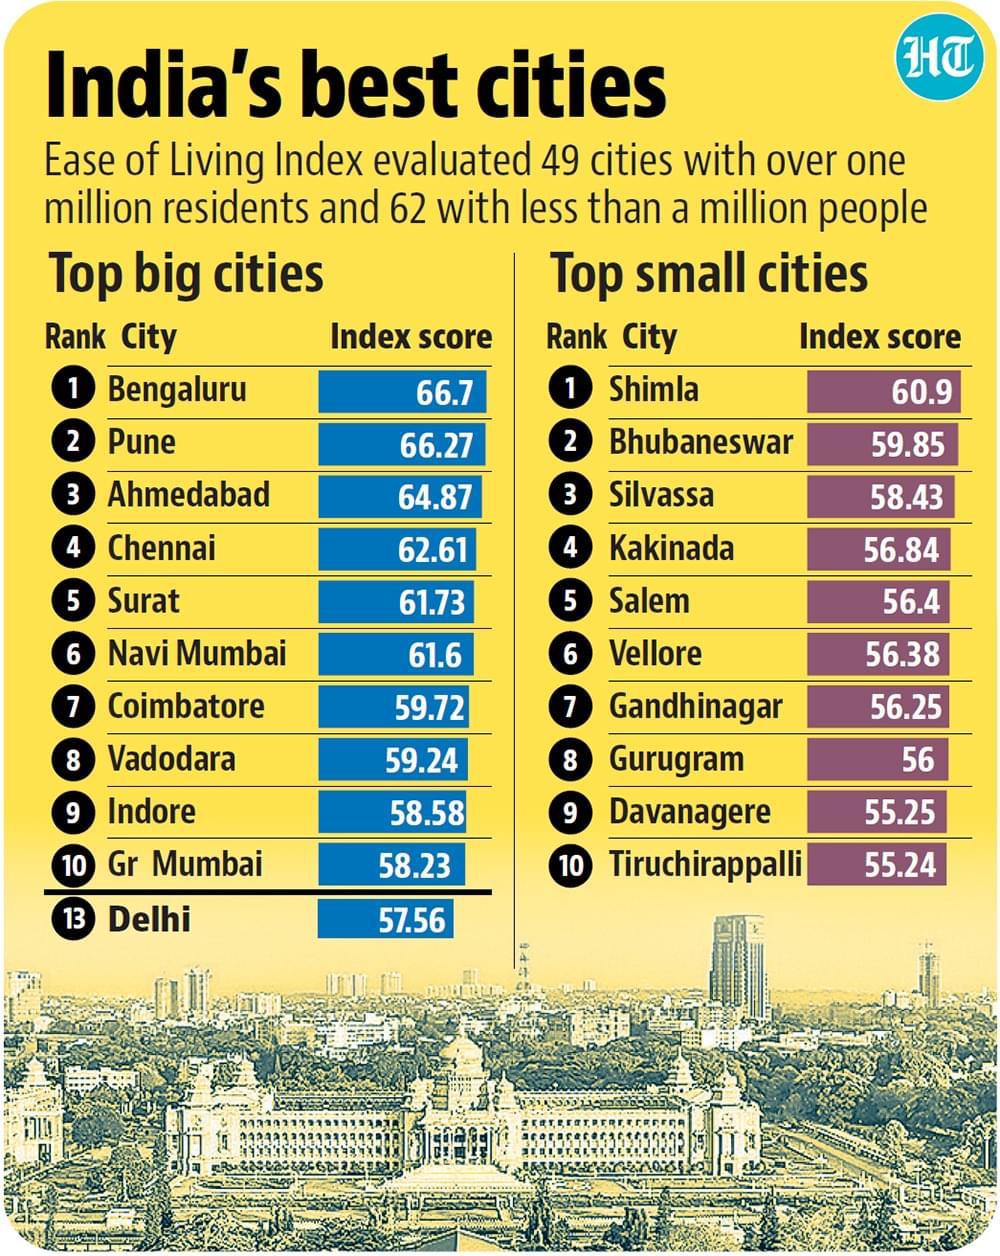
- Top Performers:
- Bengaluru followed by Pune and Ahmedabad.
- Worst Performers:
- Amritsar, Guwahati, Bareilly, Dhanbad and Srinagar.
- Top Performers:
- Less than Million Category:
- Top Performers:
- Shimla followed by Bhubaneshwar and Silvassa.
- Worst Performers:
- Aligarh, Rampur, Namchi, Satna and Muzaffarpur.
- Top Performers:
- Million+ Category:
- Significance:
- Provide Holistic Assessment:
- These indices provide a holistic assessment of cities based on their efforts to cultivate better quality of life, create infrastructure, and address challenges of urbanization.
- Help In Overcoming Deficiencies:
- Learnings gathered from these indices can help the government identify gaps, tap into potential opportunities, and increase efficiency in local governance to improve the lives of citizens and fulfil broader development outcomes.
- Complement SDG Goals:
- These indicators are also linked with the majority of Sustainable Development Goals (SDGs), specially to the SDG 11 (Sustainable Cities And Communities).
- Provide Holistic Assessment: