Gist of Economic Survey 2019-20 | 26 May 2020
WEALTH CREATION: THE INVISIBLE HAND SUPPORTED BY THE HAND OF TRUST
For more than three-fourths of known economic history, India has been the dominant economic power globally, a major wealth creator and a significant contributor to the world’s GDP.
Wealth Creation
- The wealth created by the entrepreneur correlates strongly with:
- The benefits that accrue to the employees working with the firm
- Raw materials procured by the entrepreneur’s firms and its suppliers
- Capital expenditures made by the firm
- Foreign exchange revenue earned by the firms and its role in macroeconomic stability by enabling the country to pay for its imports
- The taxes paid by the entrepreneurs enable Government spending on creating public goods and providing welfare benefits
- Wealth creation happens in an economy when the right policy choices are pursued. For instance, wealth creation and economic development in several advanced economies has been guided by Adam Smith’s philosophy of the invisible hand.
- During much of India’s economic dominance, the economy relied on the invisible hand of the market for wealth creation with the support of the hand of trust.
- The invisible hand of markets, as reflected in openness in economic transactions, was combined with the hand of trust by appealing to ethical and philosophical dimensions.
Historical Context
- Wealth creation has been recognised by various ancient treatises like Arthashashtra of Kautilya, and Thirukkural of Thiruvalluvar.
- Kautilya postulates the role of prices in an economy. He avers that the root of wealth is economic activity and lack of it brings material distress. In the absence of fruitful economic activity, both current prosperity and future growth are in danger of destruction.
- For Kautilya, a king can achieve the desired objectives and abundance of riches by undertaking productive economic activity. However, Kautilya advocates economic freedom by asking the King to remove all obstructions to economic activity.
- Thiruvalluvar mentions ‘Porul Paal’ or the essence of material wealth and declares, “Make money - there is no weapon sharper than it to sever the pride of your foes.”
- Nevertheless, Thirukural advocates wealth creation through ethical means. He avows that wealth yields righteousness and joy, the wealth acquired capably without causing any harm.
- A key contributor to ancient India’s prosperity was internal and external trade. Two major highways, Uttarapatha (the Northern Road) and Dakshinapatha (the Southern Road), and its subsidiary roads connected the sub-continent. Ports along India’s coastline traded with Egypt, Persia, China and Japan among others.
- Much of this trade was carried out by large corporatized guilds akin to today’s multinationals and were funded by temple-banks. Thus, commerce and the pursuit of prosperity is an intrinsic part of Indian civilizational ethos.
The Invisible Hand of Markets
- For several decades after Independence, India deviated from its rich tradition of emphasizing wealth creation. Despite the dalliance with socialism India has embraced the market model - post-liberalization of 1991 - that represents our traditional legacy.
- Enabling the invisible hand of markets i.e. increasing economic openness, has a huge impact in enhancing wealth. Indeed, the sectors that were liberalized grew significantly faster than those that remain closed.
- To illustrate, the growth has been significantly greater in open sectors such as cement and steel, roads, etc. than closed sectors such as coal, railways etc.
- This is not surprising as the market economy is based on the principle that optimal allocation of resources occurs when citizens are able to exercise free choice in the products or services they want.
Trust as a Public Good
- Despite the importance of the invisible hand of markets, in a market economy, there is a need for the state to ensure a moral hand to support the invisible hand. Markets are liable to debase ethics in the pursuit of profits at all cost.
- Even ancient philosophers consider trust as an important element in society and postulate that trust can be furthered by appealing to ethical and philosophical dimensions.
- Trust can be conceptualized as a public good with the following characteristics:
- Non-excludability - citizens can enjoy its benefits at no explicit financial cost.
- Non-rival consumption - the marginal cost of supplying this public good to an extra citizen is zero.
- Non-rejectable - collective supply for all citizens means that it cannot be rejected.
- Unlike other public goods, trust grows with repeated use and therefore takes time to build. Lack of trust represents an externality where decision-makers are not responsible for some of the consequences of their actions.
- Aristotle holds that good laws make good citizens, by inculcating habits and social virtue. For Confucius, people become “upright” when guided by “virtue” and regulated by “ritual” rather than by orders and penalties.
- Kautilya’s Arthashastra (Treatise on Wealth) states four branches of knowledge that further good governance:
- Varta (economic policy)
- Dandaneti (law and enforcement)
- Anvikshiki (philosophical and ethical framework)
- Trayi (cultural context)
- To sum up, the intrinsic motivation to be “trustworthy” can generate trust as a public good while the intrinsic motivation of uninhibited greed can debase the same public good of trust.
Implications of Lack of Trust
- The Global Financial Crisis represented a glaring instance of the failure of trust in a market economy.
- When a corporate intentionally misreports financial information, it harms investors by creating a negative externality of low trust for all domestic and international investors.
- When a corporate wilfully defaults on its loans, it harms its bank and creates negative externality to all other corporates as they get lesser supply of credit because of lack of trust.
Way Forward
- Reducing Information Asymmetry
- Opportunism leading to repression of the hand of trust can be remedied through standardising enforcement systems and public databases.
- For instance, in the case of wilful defaults pre-2014, inability to access relevant borrower data was a key driver of information asymmetry.
- If the Indian economy had the data infrastructure such as CRILC (Central Repository of Information on Large Corporates) during the in pre-2014 credit boom, the extent of systemic NPAs may have been lower.
- Enhancing the Quality of Supervision
- The government needs to support the hand of trust by being a good referee of the economy. The referee’s job is to not just report but also detect opportunistic behaviour.
- To illustrate, the human resource deficit among the regulators (RBI, SEBI, CCI etc.) needs to be reduced. Significant investments in technology and analytics also needs to be made.
Central Repository of Information on Large Corporates (CRILC)
- CRILC was set up by RBI to collect, store and disseminate credit data to lenders.
- Banks are required to earmark large corporate borrowers with total credit exposure of ₹5 crore.
- With CRILC when a borrower defaults with one lender, other lenders can contractually tag their loan too as a default and therefore recall the loan.
ENTREPRENEURSHIP AND WEALTH CREATION AT THE GRASSROOTS
Entrepreneurship is an important strategy to fuel productivity growth and wealth creation in an economy. Entrepreneurs are seen as agents of change that accelerate innovation in the economy.
Key Points
- As per the World Bank data, India ranks third in number of new firms created. In other words, India has the 3rd largest entrepreneurship ecosystem in the world.
- However, on a per-capita basis, India has low rates of entrepreneurship in the formal economy. In contrast to other countries, a large number of India’s enterprises operate in the informal economy.
- The entrepreneurial intensity is significantly higher for the developed economies.
- Entrepreneurship acts as an engine of economic growth and change in India.
- Entrepreneurship at district level has a significant impact on wealth creation at the grassroots. A 10% increase in registration of new firms in a district yields a 1.8% increase in Gross Domestic District Product (GDDP).
- Birth of new firms in India is heterogeneous and dispersed across districts and sectors.
Spatial Heterogeneity in Entrepreneurial Activity
- All regions demonstrate strong growth in entrepreneurial activity over time with the exception of the Eastern states.
- The peninsular states dominate the entry of new firms, but entrepreneurship is dispersed across India, not restricted just to a few metropolitan cities.
- However, all regions demonstrate a strong relationship between entrepreneurship and GDDP.
- The impact of new firm entry is greatest in the Manufacturing and Services sectors.
- Agriculture Sector
- Relative to entrepreneurial capabilities in Manufacturing, Services and Infrastructure, entrepreneurial capabilities in the Agriculture sector are not geographically localized and seem to be distributed evenly across most districts in India.
- States in the highest quintile of relative entrepreneurial activity in the Agriculture sector are Manipur, Meghalaya, Madhya Pradesh, Assam, Tripura and Odisha.
- Manufacturing Sector
- Entrepreneurial activity in the Manufacturing sector is highest in the regions of Gujarat, Meghalaya, Puducherry, Punjab and Rajasthan.
- The nature of establishments in these regions attests to agglomeration economies i.e. the incumbent industrial structures for input and output markets and specialized labour in a region are strongly linked to higher entrepreneurial activity in that industry-region.
- Spatial heterogeneity in the Manufacturing sector emphasizes the need for policy reforms that improve the ease of doing business including labour reforms, reduction in compliance burden, transparent and timely processing of approval and renewal of applications among others.
- Services Sector
- Entrepreneurial activity in the Services sector is highest in the regions of Delhi, Mizoram, Uttar Pradesh, Kerala, Andaman and Nicobar, and Haryana.
- The nature of establishments in these regions is not reflective of agglomeration economies and spans diverse industries such as trading, financial services, tourism and hospitality services, retailing, and even religious leagues and missions.
Entrepreneurial Activity and Unemployment
- Based on the data of the Periodic Labour Force Survey (PLFS):
- Entrepreneurial activity in the agriculture and manufacturing sectors shares a negative spatial correlation with the unemployment rate across states.
- Entrepreneurial activity in the services and infrastructure sectors shares a positive spatial correlation with unemployment rate across states.
- To illustrate, the number of active one-person new firms in the services sector is almost five times more that in all the other three sectors combined.
Determinants of Entrepreneurial Activity
- Social Infrastructure
- Districts with better education levels are expected to have higher entrepreneurial activity.
- Higher education levels in a district enable the development of better human capital that relates to increased supply of ideas and entrepreneurs.
- Higher education also increases the supply of talent available to entrepreneurs for managing and growing their companies.
- The number of new firms formed increases with an increase in the literacy in the district. The impact is most pronounced when literacy is above 72%. This suggests that small increases in literacy levels matter less.
- To illustrate, new firm formation is the lowest in eastern India where the literacy rate is the lowest (59.6% as per 2011 Census).
- Physical Infrastructure
- The basic measures of physical infrastructure includes accessibility in terms of tar roads. It also includes access to other public goods like electricity, water/sanitation facilities, and telecom services that are fundamental to all businesses.
- Proximity to large population centers likely allows the startup to expand markets and scale operations.
- However, beyond a point, increased proximity and connectivity to local markets may create hyper-competition and discourage entrepreneurship.
- On similar lines, beyond a point, increased levels of infrastructure development might also open up potential entrepreneurs to other opportunities and consequently, decrease the incentives to become entrepreneurs.
- On the contrary, no such diminishing returns are apparent with increases in literacy or improving education infrastructure. Increasing literacy levels or the formation of new colleges appear to increase the number of new firms monotonically.
Way Forward
- Measures need to be taken to increase the literacy levels rapidly through the institution of more schools and colleges. This will spur entrepreneurship and consequently wealth creation at grassroots. Governments could also explore the privatization of education to augment education capacity at all levels of education.
- Better connectivity of villages through tar roads will likely improve access to local markets and improve entrepreneurial activity. However, in terms of prioritization, this may not be as crucial as investments in education. Moreover, increasing the access to local markets might create other types of opportunities which might discourage entrepreneurship.
- Policies that foster ease of doing business and flexible labour regulation foster entrepreneurial activity, especially in the manufacturing sector. As the manufacturing sector has the potential to create the maximum jobs, states must focus on enabling ease of doing business and flexible labour regulation to foster job creation.
Key Terms
- MCA 21: A public dataset of the Ministry of Corporate Affairs (MCA) that provides a snapshot of all active firms registered with the MCA between 1990 and 2018.
- SHRUG: An acronym for Socioeconomic High-resolution Rural-Urban Geographic Dataset on India. It comprises a set of variables that describe the extent of socio-economic development in India in terms of demographic, socioeconomic, firm and political infrastructure of every district between 1990–2018.
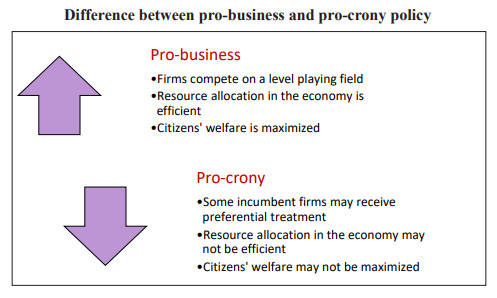
PRO-BUSINESS VERSUS PRO-CRONY
India’s aspiration to become a $5 trillion economy depends critically on promoting “pro-business” policy that unleashes the power of competitive markets to generate wealth. At the same time, it demands weaning away from “pro-crony” policy that favours specific private interests, especially powerful incumbents.
Key Points
- The liberalization of Indian economy in 1991 unleashed competitive markets which marked an increase in market dynamism. It enabled the forces of creative destruction, generating benefits that we still witness today.
- The relationship between pro-business policy and creative destruction is mirrored in the composition of the Sensex over the years.
- After the market reforms of 1991, Sensex has not only grown, but has grown at an accelerating pace.
- The years following 1991 liberalization saw the rapid emergence of new firms, new ideas, new technologies and new operating processes, causing a steep revision of the Sensex.
- New sectors like banks and financials entered the index for the first time, eroding the predominance of the manufacturing sector on the index, placing the services sector on the map for the first time, and reflecting the far reaching changes that the Indian economy was witnessing in the wake of liberalization.
- Moreover, today’s Sensex is not only composed of a larger number of sectors, but is also far more democratic in terms of the size of companies. Today’s Sensex is far less concentrated than the Sensex of the 1980s and 1990s, and mirrors the far lower sectoral concentration of the Indian economy as a whole.
Creative Destruction
- Creative destruction is a process of industrial mutation that incessantly revolutionizes the economic structure from within, destroying the old one and creating a new one.
- Viewed from the lens of the Stock market, creative destruction has increased significantly post-liberalisation.
- Liberalization led to a spike in the number of firms churned. Every five years, roughly one-third of the firms in the Sensex are replaced.
- Before liberalisation, a firm was expected to stay in the Sensex for 60 years, which decreased to only 12 years after liberalization.
- The forces of creative destruction following liberalization in the Indian economy have led to the rise of new sectors such as financials and information technology. Nonetheless, the Herfindahl Index reveals an overall decline in concentration in both sectors.
- However, it has only one prerequisite – a pro-business policy stance that fosters competitive, unfettered markets.
NOTE: Herfindahl Index measures the market concentration of an industry's 50 largest firms in order to determine if the industry is competitive or nearing monopoly.
Benefits of Creative Destruction
- The rising share in market capitalization has been accomplished by a rise in number of companies rather than a rise in size of incumbent, suggesting greater competition within these sectors.
- Sectors once considered mainstays of the Indian economy are being displaced by new sectors bringing with them new technologies and products.
- The competitive advantage of entrenched firms is being rapidly challenged by new, smaller and more agile firms.
- The difference between the sizes of the largest and smallest firms are rapidly shrinking, and consequently monopoly power in the economy is declining and making way for more competitive markets.
- Consumers benefit from an increased variety of goods and services, lower prices and incessant improvement in the quality of existing products.
Pro-crony Policies
- Pro-crony policy supports incumbent firms but does not necessarily foster competitive markets.
- Cronyism erodes wealth and fosters inefficiencies erode wealth in the economy by inhibiting the process of creative destruction.
- The best illustration of pro-crony policy can be given by connected firms i.e the firms whose promoters have political connections. For example, the Comptroller and Auditor General’s audit report on the 2G spectrum allocation named a list of private companies that benefited from alleged collusion in the allocation of the 2G spectrum.
- The connected firms are unable to systematically create value for their investors from extracting rents based on their political connections.
- The performance of connected firms indicates the possible extent of rents extracted by these firms at society’s expense.
Connected Firm and Rent Extraction
- The phenomenon of rent-seeking by inefficient, connected firms, though unhealthy to the economy, is not unique to India. In fact, several global studies reinforce the relationship between such connections and rent-seeking activities when institutional checks and balances are weak.
- Politically connected firms enjoy a myriad of benefits:
- Markets anticipate additional sources of profit for the politically connected firm despite no change in firm fundamentals.
- Distressed politically connected firms are significantly more likely to be bailed out by the government than their non-connected counterparts.
- Access to bank finance is an important channel through which political connections operate.
- When business owners come to political power, they use it to implement regulations and public policies favorable to their firms.
- These benefits represent direct and indirect forms of rent unduly enjoyed by the connected firm’s shareholders at the expense of unconnected firms and society at large.
- Additionally, pro-crony policies create various indirect costs as well by destroying value in the economy:
- When opportunities for crony rent-seeking exist, firms shift their focus away from growth through competition and innovation towards building political relationships, thus undermining the economy’s capacity for wealth creation.
- Further, the rents sought by cronies are paid for by genuine businesses and citizens who are not receiving any preferential treatment.
- Such a transfer of wealth exacerbates income inequality in the economy, as crony firms leverage their connections to extract a larger share of existing wealth instead of expanding the available wealth.
Discretionary Allocation vis-à-vis Allocation via Auctions
- The divergent impacts of pro-business and pro-crony policies can be understood in terms of natural resources. For this, discretionary allocation vs allocation via auctions of coal can be considered.
- Coal is the most important indigenous source of energy for India; it meets more than half of India’s energy requirements. India has the fifth largest coal reserves in the world behind USA, Russia, China, and Australia.
- Prior to 1993, no specific criteria for the allocation of captive mines existed. In 1993, amendments were introduced to the Coal Mines (Nationalisation) Act 1973. It allowed private companies to carry out coal mining for captive use.
- A screening committee was set up to consider applications made by various companies interested in captive mining and to allocate coal blocks for development.
- In 2012, the CAG report on coal block allocations examined the effectiveness of the processes adopted in allocation of coal blocks. In 2014, the Supreme Court cancelled 214 of the 218 allocations made by the Government of India over a span of 15 years.
- The Government acted and passed the Coal Mines (Special Provisions) Act, 2015. It ensured that future allocation of coal blocks would solely be through competitive auctions.
Related Party Transactions (RPTs) and Allocations
- The form of coal block allocation (committee-based vs competition-based) has an impact on the value of Related Party Transactions (RPTs) engaged in by firms that are beneficiaries of the coal block allocation.
- RPTs used for purchasing capital goods/equipment from related parties are classified as Capital Purchases. Operational expenses paid to related parties are classified as Revenue expenses. Operational income from related parties are classified as Revenue income.
- These three RPTs show a marked increase following the receipt of a coal block through the committee-based allocation. No such increase is seen in the case of auction-based allotment.
- Capital purchases offer an ideal mechanism to transfer wealth because they are large one-time non-recurring cash outflows that can serve as an opportune mask to hide transactions from regulators.
- The other three main types of RPTs – Capital Sales, Loans and advances given and taken do not show any particular increase in the case of the committee-based allocation.
- Moreover, as foreign entities are harder for the domestic enforcement authorities to track, RPTs with such entities are likely to manifest for purposes of opacity. Similarly, tax havens are characterized by opaque disclosure regulations and hence serve as an ideal sink to tunnel corporate wealth away from other stakeholders.
- Capital purchases, revenue expenses and revenue income show a remarkable increase post the receipt of the coal block in the committee-based allotment process but not following competitive auctions.
- One-time payments to directors like commissions, perquisites and consulting expenses increase following the discretionary allocation.
Firm Productivity and Performance
- There has been a steady decline in the market share of firms that received committee-based allocation despite them getting a windfall gain from the discretionary allocation.
- The gain of an almost free resource should have aided firm productivity and business fundamentals. Instead the market share has fallen over the years - suggesting a case of Dutch disease – firms that got the free resource diverted efforts towards the tunnelling of the windfall gain instead of towards productive business activity.
- Discretionary allocation of natural resources by a committee provides avenues for rent seeking. Subsequently, firm owners divert their focus towards tunnelling away these rents rather than furthering productive economic activities.
- A shift to market-based allocation of resources takes these avenues away, encourages productive economic activity and generates more wealth.
Dutch Disease
- Dutch disease stands for the negative consequences that can arise from a spike in the value of a nation’s currency.
- The term was coined owing to the after impacts of the discovery of vast natural gas deposits in the North Sea (The Netherlands) in 1959.
- The newfound wealth and massive exports of oil caused the value of the Dutch guilder (the erstwhile currency) to rise sharply, making Dutch exports of all non-oil products less competitive on the world market.
- In simple terms, the term Dutch disease is used in economic circles to describe the paradoxical situation in which seemingly good news, such as the discovery of large oil reserves, negatively impacts a country's broader economy.
Riskless Returns: The Case of Wilful Default
- Wilful default occurs when firms take loans, divert the proceeds out of the firm for the personal benefit of owners, default on loans and declare bankruptcy, thereby expropriating a range of stakeholders – lenders, minority shareholders, employees, regulators and state coffers.
- The RBI defines wilful defaulter as a firm that has defaulted in meeting its repayment obligations even though it has the capacity to honour these obligations.
- A firm could also be branded a wilful defaulter if it uses the funds for purposes other than what is sanctioned by the lender, siphons the money out to related parties or removes the assets used to secure the loan.
- Wilful defaulters tend to be more opaque than both non-defaulters and firms that default out of genuine distress.
- Money lent to a genuine business creates assets, which generate profit and employment. On the other hand, every rupee lent to a wilful defaulter constitutes an erosion of wealth as the firm does not invest the proceeds in profitable projects. Besides making cronies rich, it contributes nothing to the economy.
- As of 2018, wilful defaulters owed their respective lenders nearly ₹1.4 lakh crores. The defaulters are spread across several sectors, with manufacturing firms constituting the largest share.
Implications of Wilful Default
- To put in perspective the quantum of wealth eroded by wilful defaulter can be compared with the 2018 Union budget allocations towards citizen welfare. Had the money siphoned away by wilful defaulters stayed in the economy, the resulting wealth would have been equivalent to double the allocation towards health, education and social protection.
- The cost of wilful default is borne by the common man. Public sector banks get their equity from taxes paid by the common man. When unscrupulous firms willfully default, it is the common man who loses. While most policy initiatives aim to redistribute wealth from the rich to the poor, wilful default achieves the opposite. Rich businesses that want to get richer use wilful default as an instrument to redistribute wealth away from the poor.
- Wilful default increases the cost of borrowing for everyone else, including genuine businesses. It may force genuine borrowers to exit the market resulting in a market failure that slows economic growth, employment and wealth creation capacity.
Conclusion
- Pro-business policies, for example, those that make it easy to start a business, obtain credit, and bid for natural resources help firms to function effectively and thereby enable competitive markets.
- While pro-business policies increase competition, correct market failures, or enforce business accountability, pro-crony policies hurt markets.
- Crony businesses may promote narrow business interests and may lobby the government to limit competition or reduce regulatory oversight. These enhance the lobbying group’s income but undermine markets and reduce aggregate welfare.
UNDERMINING MARKETS: WHEN GOVERNMENT INTERVENTION HURTS MORE THAN IT HELPS
The role of markets has been recognized globally wherein markets are allowed to enable wealth creation and thereby economic growth. But India has a regulated system and its high time that privatization and the role of the free market are analysed and incorporated in the economy.
Key Points
- Economic freedom enhances wealth creation by enabling efficient allocation of entrepreneurial resources and energy to productive activities, thereby promoting economic dynamism.
- India has made significant progress in enhancing economic freedom for firms and its citizens but it still counts among the shackled economies in the world.
- In the Index of Economic Freedom 2019, India was categorized as ‘mostly unfree’, ranking the Indian economy 129th among 186 countries. Likewise, in the Global Economic Freedom Index, India ranks 79th among 162 countries with 108th rank in business regulation.
- The low rank in economic freedom makes it evident that India chains opportunities for wealth creation by shackling economic freedom for its citizens.
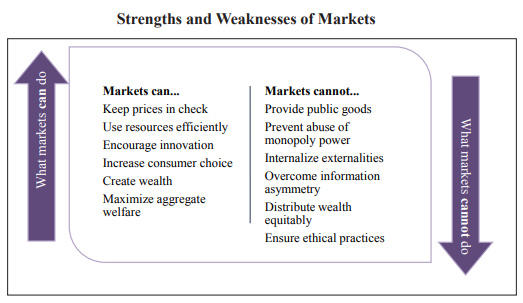
- While there is a case for Government intervention when markets do not function properly, excessive intervention stifles economic freedom.
- This is because government intervention, though well-intended, often ends up undermining the ability of the markets to support wealth creation and leads to outcomes opposite to those intended.
Government Interventions
- The Government can intervene in markets in two ways:
- Direct participation - as a market maker or as a buyer or supplier of goods and services
- Indirect participation - through regulation, taxation, subsidy or other influence
- Sometimes direct intervention by the government affects the dynamic interaction of supply and demand in markets and thereby determination of ‘equilibrium’ market prices.
- To illustrate, fluctuating prices of the commodities distort the demand and supply chain of the market. For example, when prices are higher, the sale gets reduced and when prices are lower, the demand gets increased.
- In both cases, serious welfare loss results because not enough of the goods are sold. The chance to create welfare for both producers and consumers gets wasted and it leads to ‘deadweight loss’ - income that is lost forever.
- The Indian economy is replete with examples where the government intervenes even if there is no risk of market failure. In some instances, its intervention has created market failures.
Essential Commodities Act (ECA), 1955
- The Act controls the production, supply and distribution of, and trade and commerce in, certain goods which are treated as essential commodities. The powers to implement the provisions of the Act are delegated to the States.
- The major commodity groups included in the Act are
- Petroleum and its products
- Food stuff, including edible oil and seeds, vanaspati, pulses, sugarcane, onion, potato
- Raw Jute and jute textiles
- Essential drugs
- Cattle fodder
- When the price of any of these essential commodities rises, the regulator can impose stock holding limits on the commodity, restrict the movement of goods, and mandate compulsory purchases under the system of levy.
- The purported aim of the Act is to ensure the affordability of essential commodities for the poor by restricting hoarding.
- Consequently, it becomes an overarching legislation regulating agricultural marketing and production.
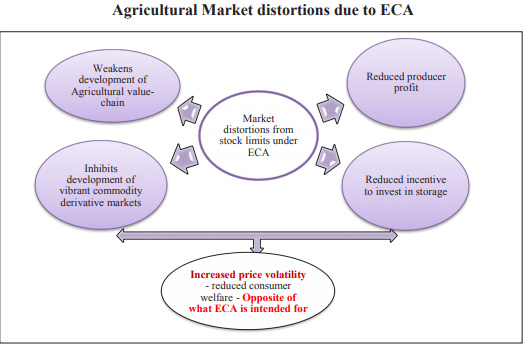
ECA Affects the Development of Agricultural Markets
- It reduces the effectiveness of free trade and the flow of commodities from surplus areas to markets with higher demand.
- Agriculture is a seasonal activity and it is essential to store produce for the off-season. Due to frequent and unpredictable imposition of stock limits, ECA disincentivises investments in warehousing and storage facilities.
- As stockholding limits apply to the entire agriculture supply chain, including wholesalers, food processing industries and retail food chains, the Act does not distinguish between firms that genuinely need to hold stocks owing to the nature of their operations, and firms that might speculatively hoard stocks.
- ECA also affects the commodity derivative markets as traders may not be able to deliver on the exchange platform the promised quantity, owing to stock limits.
- The Act distorts markets by increasing uncertainty and discouraging the entry of large private sector players into agricultural marketing.
- These market distortions further aggravate the price volatility in agricultural commodities, the opposite of what it is intended for. For example, imposition of stock limits on onions in September 2019 spiked up the volatility of the retail and wholesale prices of onions.
Other Challenges with the ECA
- Frequent raids under the provisions of ECA have been ineffective due to low conviction rate, corruption and increase in harassment of traders.
- The ECA was enacted at a time when speculative hoarding and black marketing was a threat as agricultural markets were fragmented and transport infrastructure was poorly developed. With the agricultural markets in India increasingly becoming more integrated, the utility of the Act is incompatible with the development of an integrated competitive national market for food.
- The anti-hoarding provisions of ECA discourage open reporting of stock holdings, storage capacities and trading. Moreover, there is no data of the total private storage capacity available in the country.
Way Forward
- Strengthening of the Price Stabilization Fund as it supplements the market forces rather than substitute them which the ECA does.
- Supporting the development of commodity futures markets would help efficient discovery of market expected future prices, which can provide a better basis for private storage decisions and avoid ‘peaks’ and ‘troughs’ in prices.
- Development of effective forecasting mechanisms, stable trade policies, and increasing integration of agricultural markets can serve the purpose of stabilising prices of agricultural markets.
Price Stabilization Fund (PSF)
- PSF was established in 2014-15 to help regulate the price volatility of important agri-horticultural commodities like onion, potato and pulses.
- It provides for maintaining a strategic buffer of the commodities for subsequent calibrated release to discourage hoarding and unscrupulous speculation.
Drug Price Control under ECA
- The government often resorts to price controls for drugs to ensure access to essential lifesaving drugs and to avoid poor households from falling into poverty.
- The National List of Essential Medicines (NLEM), prepared by the Ministry of Health and Family Welfare, is a list of medicines considered essential and high priority for India’s health needs. It is based on aspects like prevalence of disease, safety and efficacy of the medicine, and affordability.
- Prices of pharmaceutical drugs are regulated through the National Pharmaceutical Pricing Authority (NPPA) and Drug (Price Control) Order (DPCO).
- DPCOs are issued by the Government, in the exercise of the powers under the Essential Commodities Act (ECA), 1955. The DPCO, among other things, specifies the price ceiling and the formula for calculating the ceiling price.
- DPCOs seek to ensure that the medicines listed under National List of Essential Medicines (NLEM) are available at a reasonable price to the general public.
- The Government of India has amended the DPCO several times. Until 2013, DPCO specified the price ceiling using the cost-based pricing method in which the ceiling price was calculated as a multiple of the cost that it took producers to promote and distribute a pharmaceutical drug.
- In 2013, India transitioned from cost-based pricing to market-based pricing. Under the market-based pricing method, the Government determines the ceiling prices as the maximum mark-up that a retailer can charge over the reference price, which is the simple average of the prices of all the major brands. The order capped the maximum mark-up to 16% for all formulations specified in the NLEM.
Implications
- The outcome of DPCO is quite opposite to what it aims to do - making drugs affordable.
- The regulation of prices of drugs led to an increase in the price of the regulated pharmaceutical drug vis-à-vis that of an unregulated but similar drug.
- The increase in prices is greater for more expensive formulations than for cheaper ones and for those sold in hospitals than retail shops.
Way Forward
- Government, being a major buyer of drugs, can intervene more effectively to provide affordable drugs by combining all its purchases and exercising its bargaining power.
- The prevalent distorting interventions need to be replaced by market-friendly interventions like price stabilization funds, Direct Benefit Transfers (DBT) to consumers, incentives to innovations, increasing market integration and smooth flow of goods and services.
Government Intervention in Grain Markets
- In the grain markets, the government has sought to achieve food security while ensuring remunerative prices to producers and safeguarding the interest of consumers by making supplies available at affordable prices.
- In trying to achieve this, the state controls input prices such as those of fertilizer, water, and electricity.
- It also sets output prices, undertakes storage and procurement through administrative machinery, and distributes cereals across the country through PDS.
- These procurement operations largely support the MSPs that are designed to be indicative prices for producers at the beginning of the sowing season and floor prices as an insurance mechanism for farmers from any fall in prices.
Implications
- The government has emerged as the single largest procurer and hoarder of foodgrains. It has virtually become a monopsonist in the domestic grain market and is a dominant player crowding out private trade. This disincentivizes the private sector to undertake long-term investments in procurement, storage and processing of these commodities.
- MSPs are designed to be indicative prices for producers at the beginning of the sowing season and floor prices as an insurance mechanism for farmers from any fall in prices. However, the increasing trend in these prices have served to give a signal to farmers to opt for the crops which have an assured procurement system.
- Moreover, an increase in Minimum Support Price (MSP) translates into farmers offering their produce for the open-ended procurement by the Government. MSPs have, in effect, become the maximum prices rather than the floor price – the opposite of the aim it is intended for.
- This has also made India a high-cost foodgrain economy, given
- The economic cost of Food Corporation of India is very high and its inefficiency increases with an increase in stocks.
- The food subsidy burden is burgeoning which largely covers the procurement, distribution and carrying costs of FCI.
- Given fiscal constraints, there is always a trade-off between allocating money through subsidies and increasing investments.
- Growth in public investments in agriculture is negatively correlated to increases in food subsidy outlay.
- As investments are the crucial input to increase in productivity, the increasing focus on subsidies is harming the growth of the agricultural sector in the long-run.
- NSS 73rd round on consumer expenditure shows that the share of cereals in Monthly Per Capita Expenditure (MPCE) has fallen by about 33% in rural India and about 28% in urban India from 2004-05 to 2011-12.
- This is in line with decreasing consumption of food and increasing expenditure on non-food items as income rises.
Food Corporation of India (FCI)
- The FCI was set up in 1965 under the Food Corporations Act, 1964 with the primary duty to purchase, store, move/transport, distribute and sell foodgrains and other foodstuffs.
- The main objectives of FCI are
- procurement of foodgrains from farmers at Minimum Support Prices (MSP) announced by the Government;
- distribution of foodgrains to consumers through PDS, particularly the vulnerable sections of society at affordable prices; and
- maintenance of buffer stock of foodgrains for food security and price stability. Thus, it is mandated to serve the interests of producers and consumers alike.
- The burgeoning burden of food subsidy largely covers the procurement cost of FCI [difference between the MSP and the Central issue prices (CIP) of foodgrains under PDS] and distribution and carrying costs of FCI.
Way Forward
- India has moved from being a food scarce country to a food surplus country with a substantial increase in production and has emerged as a net exporter of cereals. The policies need to move on now to incentivize diversification and environmentally sustainable production.
- The farmers need to be empowered through direct investment subsidies and cash transfers, which are crop neutral and do not interfere with the cropping decisions of the farmer.
- The coverage of NFSA needs to be restricted to the bottom 20% and the issue prices for others could be linked to the procurement prices.
- Another alternative would be giving income transfers to consumers through Direct Benefit Transfers (DBT). Internationally, there is a move towards conditional cash transfers (CCTs) aimed at tackling problems of food insecurity and poverty and for nudging people towards improved health and education levels.
- At the macro level, the agricultural marketing, trade (both domestic and foreign) and distribution policies need to be aligned so that farmers receive the correct signals for diversification into remunerative and sustainable production.
Conditional Cash Transfers (CCTs)
- Conditional cash transfer programmes give money to households on the condition that they comply with certain pre-defined requirements.
- These conditions can include, for example, up-to-date vaccinations, regular visits to a healthcare facility, regular school attendance by children, and complying with health and nutrition promotion activities.
- Current evidence suggests that conditional cash transfer programmes can be effective in increasing the use of health services and improving health outcomes.
- Some examples of successful CCTs include
- Brazil (Bolsa Familia): Cash transfer of $15-95 to about 25% of the identified population on conditions of attending health check ups.
- Mexico (Oportunidades): Cash transfer of 235 pesos to about 20% of the identified population on conditions of mandatory health check ups.
Debt Waivers
- Government intervention in credit markets, in the form of full or partial, conditional or unconditional, debt relief has become increasingly common at the state level in India.
- Farm loan waivers re-emerged in 2008 after it had died down in the early 1990s.
Positive implications
- Borrowers seem to be suffering from the problem of ‘debt overhang’.
- It refers to a situation where all current income gets used up in repaying the accumulated debt, leaving little incentives to invest either in physical or human capital.
- Debt overhang leads to abandonment of beneficial investment and hence reduces social welfare.
- Thus, debt waiver is said to be helping the borrowers to come out of the debt trap as it cleans their balance sheet and reduces the burden of debt servicing.
- However, debt waiver can help if awarded under exceptional circumstances and remain unanticipated.
Negative implications
- Debt waivers impact the credit markets. For example, debt relief can prevent farmers from going out of farming and the consequent reduction of output but an anticipated waiver may lead to moral hazard and destroy the credit culture.
- Loan waiver led to increased loan defaults on future loans and no improvement in wages, productivity, or consumption.
- Debt waivers also have a contagious impact on bank loans i.e. defaults and non-performing assets rise on bank loans.
- Loan performance of genuinely distressed borrowers improves whereas the loan performance of non-distressed beneficiaries deteriorates.
- Debt waivers also costs the government exchequer in a significant way and that without creating any capital.
Way Forward
- A debt relief should be made conditional on genuine distress otherwise it fuels even greater default. Thus, an unconditional and blanket debt waiver is a bad idea.
- A waiver can at best be an emergency medicine to be given in rare cases after a thorough diagnosis and identification of illness and not a staple diet.
Legislative Changes Required to Reduce Government Interventions
India is still stuck with several forms of Government intervention that are anachronistic with today’s economy. In several spheres of the economy, India has traversed the transition from a command and control economy to a market-driven economy.
Acts which Transformed to Market-driven Economy
| Act | Market Distortion created | Transformation towards Developing a Market Economy |
| Capital Issues (Control) Act, 1947 |
|
|
| Oil and Natural Gas Commission (ONGC) Act, 1959 |
|
|
| Monopolies and Restrictive Trade Practices (MRTP) Act, 1969 |
|
|
| The Coking Coal Mines (Nationalisation) Act, 1972 and Coal Mines (Nationalization) Act, 1973 |
|
|
| Foreign Exchange Regulation Act, 1973 |
|
|
| Air Corporations Act of 1953 |
|
|
| Sick Industrial Companies Act (SICA), 1985 |
|
|
However, several areas of unnecessary and inefficient government intervention still remain. The following are some key Acts, as low-hanging fruits to begin with, which have outlived their use and need to be repealed or amended to enable functioning of competitive markets.
Acts which Need to be Repealed/Amended
| Act | Market Distortion Created | Need for Repeal/Amendment |
| Factories Act, 1948 |
|
|
| Essential Commodities Act (ECA), 1955 |
|
|
| Food Corporation of India (FCI), 1965 |
|
|
| Sick Textile Undertaking (Nationalisation) Act, 1974 |
|
|
| Recovery of Debts due to Banks and Financial Institutions Act, 1993 |
|
|
| The Right to Fair Compensation and Transparency in Land Acquisition, Rehabilitation and Resettlement Act, 2013 |
|
|
Conclusion
The government must systematically examine areas where the Government needlessly intervenes and undermines markets. It does not mean that there should be no government intervention; appropriate and relevant interventions are welcome, majorly at the regulation level. Eliminating instances of needless interventions will enable competitive markets and thereby spur investments and economic growth.
CREATING JOBS AND GROWTH BY SPECIALIZING IN EXPORTS IN NETWORK PRODUCTS
Integrating ‘Assemble In India for the World’ into ‘Make In India’ can set a precedent in making India a global manufacturing hub. India has to take crucial and defining steps if it wants to achieve an export-led growth and create jobs for its youth.
Key Points
- Growth in exports provides a much-needed pathway for job creation in India. For example, in just five year period 2001-2006, labour-intensive exports enabled China to create 70 million jobs for workers with primary education.
- On similar lines, steps can be taken by India to chart an export trajectory and create unparalleled job opportunities for its youth.
- China’s image as a low-cost location for final assembly of industrial products is rapidly changing due to labour shortages and increases in wages. As no other country can match China in the abundance of its labour, India must grab the space getting vacated in labour-intensive sectors.
- This also holds significance as the US-China trade war is causing major adjustments in Global Value Chains (GVCs) and firms are now looking for alternative locations for their operations.
Current State of Trade and Exports
- India’s share in merchandise (goods) exports in world exports has increased from 0.6% in 1991 to 1.7% in 2018. Yet it remains paltry compared to 12.8% for China (2018).
- Further, merchandise exports as a percentage of GDP remained consistently lower for India compared to the world average by a significant margin.
- Imports of merchandise have grown faster (at the rate of 14.9% per annum during 1993-2018) than exports, resulting in increased trade deficits.
- On the other hand, exports of services generally grew faster than imports, providing some cushion to the current account deficit.
Reasons for India’s Underperformance in Exports
- Specialization versus Diversification
- India is far behind China in terms of specialization of markets and products. However, India has been catching up with China in terms of diversification across products and markets.
- Overall, high diversification combined with low specialization implies that India is spreading its exports thinly over many products and partners, leading to its lacklustre performance compared to China.
- The bottom line is that if India wants to become a major exporter, it should specialize more in the areas of its comparative advantage and achieve significant quantity expansion.
- Low Level of Participation in Global Value Chains (GVCs)
- China’s export composition shows a strong bias towards traditional labour-intensive industries and labour-intensive stages of production processes within capital intensive industries.
- Export growth of capital intensive products from China has been mainly driven by its participation in the GVCs. China’s export promotion policies since the 1990s have relied heavily on a strategy of integrating its domestic industries within the GVCs.
- Making use of imported parts and components, China emerged as a major assembly hub for several capital-intensive products.
- India’s participation in GVCs has been low compared to the major exporting nations in East and Southeast Asia.
- Low Market Penetration in High-Income Countries
- The dominance of capital intensive products in the export basket along with low participation in GVCs have resulted in a disproportionate shift in India’s geographical direction of exports from traditional rich country markets to other destinations.
- The high-income OECD markets accounted for 49.7% of China’s exports in 2018 while the corresponding figure for India was 40.2%.
- Developing countries, especially with a low level of participation in GVCs, find it extremely difficult to export capital intensive products to the quality/brand conscious markets in richer countries.
- Thus, China’s remarkable export performance, compared to India, is driven by a set of interrelated factors - a high level of participation in GVCs; a high degree of specialization in labour-intensive production activities; large scale in the chosen sectors of specialization; and a high level of export penetration in traditional rich countries.
Related Information
Flying Geese Model
- Developed by Kaname Akamatsu during the 1930s, the flying geese paradigm (FGP) is a model for the international division of labour in East Asia based on dynamic comparative advantage.
- The paradigm/model postulated that Asian nations will catch up with the West as part of a regional hierarchy where the production of commoditized goods would continuously move from the more advanced countries to the less advanced ones.
Reaping Gains from Participation in Global Value Chains (GVCs)
- A higher level of participation in GVCs implies that for any given country, the share of foreign value-added in gross exports is higher than when most inputs are sourced locally.
- However, owing to scale and productivity effects of selling in the world markets, participation in GVCs can lead to higher absolute levels of domestic value-added and domestic job creation.
- The scale effect creates millions of jobs and is therefore particularly suited for implementation in a labour-intensive economy such as India.
- India can reap rich dividends by adopting policies aimed at strengthening its participation in GVCs.
Which Industries should India Specialize in for Job Creation?
- Given our comparative advantage in labour-intensive activities and the imperative of creating employment for a growing labour force, there are two groups of industries that hold the greatest potential for export growth and job creation.
- First, there exists a significant unexploited export potential in India’s traditional unskilled labour-intensive industries such as textiles, clothing, footwear and toys.
- The GVCs in these industries are controlled by “buyer driven” networks wherein the lead firms based in developed countries concentrate in higher value added activities such as design, branding and marketing.
- Physical production is carried out, through subcontracting arrangements, by firms in developing countries. Examples include Wal-mart, Nike, Adidas etc.
- Second, India has huge potential to emerge as a major hub for final assembly in a range of products, referred to as “network products” (NP).
- The GVCs in these industries are controlled by leading MNEs such as Apple, Samsung, Sony etc. within “producer driven” networks. In general, these products are not produced from start to finish within a given country.
- Within the production network, each country specializes in a particular fragment of the production process; this specialization is based on the country’s comparative advantage.
- Labour abundant countries, like China, specialize in low skilled labour-intensive stages of production such as assembly while the richer countries specialise in capital and skill-intensive stages such as R&D.
The Current Case of Network Products
- Examples of network products (NP) include computers, electronic and electrical equipment, telecommunication equipment, road vehicles etc.
- On an average, NP accounts for about 42% of world manufactured exports. Asia’s share in world exports of NP increased from about 37% in 2000 to 51% in 2018 while the shares of both Europe and America declined.
- India’s export of NP increased from about $2 billion in 2000 to $32 billion in 2018, however, in comparison to other Asian countries, its share is very minuscule.
- NP exports account for a very small share (10% in 2018) in India’s export basket. In contrast, these products account for about one half of the total national exports of China and Japan.
- The main category of NP exported by India is road vehicles with a share of 4.9% in its total exports in 2018. Several leading automobile companies have established assembly plants in India and some of them have begun to use India as an export base within their production networks.
- The key learning from the successful case of the Automobiles sector is that domestic firms graduate up the production value chain by first starting with low-technology operations such as assembly and then moving to manufacturing of components.
Free Trade Agreements (FTAs) and India
- There is an apprehension that most of the FTAs that India has signed in the past have not worked in India’s favour. The recent debate around India joining the Regional Comprehensive Economic Partnership has been aligned on the same context of cost and benefit analysis of FTAs.
- However, an analysis shows that the overall impact on India’s exports to the partners, with which the agreements have been signed, is 13.4% for manufactured products and 10.9% for total merchandise. The overall impact on imports is found to be lower at 12.7% for manufactured products and 8.6% for total merchandise.
- Therefore, from the perspective of trade balance, India has gained in terms of 0.7% increase in trade surplus per year for manufactured products and of 2.3% increase in trade surplus per year for total merchandise.
Way Forward
- India can reap rich dividends by adopting policies aimed at strengthening its involvement in the export market for network products (NP). Assembly is highly labour intensive, which can provide jobs for the masses, while domestic production of parts and components can create high skill jobs.
- For a country to become an attractive location for assembly activities, it is imperative that import tariff rates for intermediate inputs are zero or negligible. An enabling environment should also be created for the entry of lead firms into the country.
- A pro-active FDI policy is also critical as MNEs are the leading vehicles for the country’s entry into global production networks while local firms play a role as subcontractors and suppliers of intermediate inputs to MNEs.
- Supply disruptions in a given location due to shipping delays, power failure, political disturbances, labour disputes etc. could disrupt the entire production chain. A low level of service link costs (costs related to transportation, communication etc.) is a prerequisite for countries to strengthen their participation in GVCs.
TARGETING EASE OF DOING BUSINESS IN INDIA
Ease of doing business is the key to entrepreneurship, innovation and wealth creation. India has risen significantly in the World Bank’s Doing Business rankings in recent years.
Key Points
- As India leapfrogs towards a five trillion-dollar economy by 2024-25, simplifying and maintaining a business-friendly regulatory environment is essential.
- India has made substantial gains in the Ease of Doing Business rankings from 142 in 2014 to 63 in 2019.
- It has progressed on 7 out of the 10 parameters. The Goods and Services Tax and the Insolvency and Bankruptcy Code top the list of reforms that have propelled India’s rise in rankings.
- However, India continues to trail in parameters such as Ease of Starting Business, Registering Property, Paying Taxes and Enforcing Contracts.
- To illustrate, it takes an average of 18 days (down from 30 in 2009) to set up a business in India. On the other hand, New Zealand has a seamless process of business incorporation which takes place through one agency and just takes half-a-day.
- Similarly, it takes roughly 50 days and costs on an average 7.8% of a property’s value to register it, and 1,445 days for a company to resolve a commercial dispute.
- Thus, a holistic assessment and a sustained effort to ease business regulations and provide an environment for businesses to flourish is a key structural reform that India needs.
Density of Legislations
- A major challenge most companies face is the complex architecture of the Indian governance framework including the legislation and statutory compliance requirements.
- For example, manufacturing units have to conform with nearly 6,796 compliance items, which is a tedious task. The services sector too faces many regulatory hurdles even for routine businesses.
- Besides, In India, only the list of licences and permissions can be obtained from a government portal or information centre.
- On the other hand, in New Zealand, a dedicated website operated by a private agency has all detailed guides and stepwise procedures about permissions, fees and timeline to start a business. The website is also equipped with ready-to-use business plan templates.
- The contrast reflects a difference in approach – government control versus curation/ partnership.
Construction Permits
- Hong Kong, which tops the rankings for ease of obtaining construction permits, takes just over two months to obtain a construction permit, while Delhi takes almost four months.
- It must be observed that India has improved the process of obtaining a construction permit, as it took 186 days in 2014, it now takes 98-113 days in 2019.
Achieving Scale of Across Business
- Most of the manufacturing units in India have small capacities and consequently low manufacturing efficiencies which are a disadvantage in the global supply chain.
- Compared to Bangladesh, China, and Vietnam, which have more than 80% of market value of exports by large enterprises, India has 80% by small enterprises.
- Moreover, in India it can take 7-10 days to reach a port whereas in countries like China, Bangladesh and Vietnam it takes less than a day.
- Countries like Bangladesh, China, Vietnam are able to progress in the value chain by increasing their competitiveness in the international market by improving their delivery time and domestic production capacity.
Trading across Borders
- This indicator records the time and cost associated with the logistical process of exporting and importing goods.
- Globally, transportation by ports is the most favoured followed by railways and then roads, whereas in India it is the other way round.
- While India takes 60-68 and 88-82 hours in border and documentary compliance for exports and imports respectively, Italy takes only one hour for each. Italy tops the EoDB rankings in Trading across Borders.
- Almost 70% of the delays (both in exports and imports) occur on account of port or border handling processes pertaining to procedural complexities, multiple documentations and involvement of multiple agencies for approval and clearances.
- Such delays and procedural inefficiencies end up pushing the cost to trade.
- Government has reduced procedural and documentation requirements considerably, increasing digitalization and seamlessly integrating multiple agencies onto a single digital platform.
- Authorized Economic Operators scheme is also being used to smoothen the process for registered exporters/importers.
- The turnaround time of ships in India has been on a continuous decline. This shows that achieving significant efficiency gains in the case of sea ports is possible.
Way Forward
- Given the maze of laws, rules and regulations in the manufacturing and services sector, the scope for streamlining is clear.
- The streamlining of the logistics process at sea-ports requires close coordination between the Logistics division of the Ministry of Commerce and Industry, the Central Board of Indirect Taxes and Customs, Ministry of Shipping and the different port authorities.
- The simplification of the Ease of Doing Business landscape of individual sectors such as tourism or manufacturing, however, requires a more targeted approach that maps out the regulatory and process bottlenecks for each segment.
Authorised Economic Operators (AEO)
- AEO is a programme under the aegis of the World Customs Organization (WCO) SAFE Framework of Standards.
- AEO seeks to secure and facilitate global trade. It aims to enhance international supply chain security and facilitate the movement of goods.
- Under this, an entity engaged in international trade is approved by WCO as compliant with supply chain security standards and granted AEO status. An entity with an AEO status is considered a ‘secure’ trader and a reliable trading partner.
- Benefits of AEO status include expedited clearance times, fewer examinations, improved security and communication between supply chain partners, and more.
- AEO is a voluntary programme.
GOLDEN JUBILEE OF BANK NATIONALISATION: TAKING STOCK
In 2019, India completed the 50th anniversary (Golden Jubilee) of the bank nationalization program undertaken in 1969.
Key Points
- This is apt to celebrate the accomplishments. At the same time, an objective assessment of Public Sector Banks (PSBs) is apposite.
- Currently, PSBs account for 70% of the market share in banking. Despite being dominant players, they lag considerably in performance metrics when compared to their peers.
- Dwarfism of our banking sector is quite evident when assessed on three characteristics ; size of the economy (GDP), development of the economy (GDP per capita) and population.
Dwarfism of Our Banking Sector
- Size of the Economy
- India’s banking sector is disproportionately underdeveloped given the size of its economy.
- For instance, ranked at 55th in the world, State Bank of India (SBI) is the only bank from India that figures in the global top 100 banks. Due to this characteristic India is grouped with countries that are a fraction of its size like Finland and Denmark.
- All the largest economies have proportionately large banks with China being an outlier with 18 banks in the global top 100.
- Development of the Economy
- India as an outlier when the penetration of credit to the private sector is plotted against the GDP per capita of a country.
- Historically, economies have always been ably supported by their banks. The U.S., Japan, and China are the best example of this.
- The support of the U.S. banking system in making the U.S. an economic superpower is well documented. Similarly, in the eighties during the heydays of the Japanese economy, Japan had 15 of the top 25 largest banks then. In recent times, China has emerged as an economic superpower and it has been ably supported by its banks - the top four largest banks globally are all Chinese banks.
- Thus, a large economy needs an efficient banking sector to support its growth. Yet, credit growth among PSBs has declined significantly since 2013.
- India becoming a $5 trillion economy will require at least eight Indian banks to be large enough to belong in the top 100 globally.
Why the Banking Sector Needs Urgent Attention?
- Fulfilment of social goals can happen at scale through financial intermediation. Given India’s demographics and the growth opportunities, we need a thriving banking sector which can support and unleash a multiplier effect and permanently alter India’s growth trajectory in a positive way.
- Conversely, inefficient PSBs can severely handicap the country's ability to exploit the unique opportunities.
- In 2019, PSBs’ collective loss - largely due to bad loans - amounted to over ₹ 66,000 crores, an amount that could nearly double the nation’s budgetary allocation for education.
- PSBs account for 85% of reported bank frauds while their gross non-performing assets (NPAs) equal ₹ 7.4 lakh crores which is more than 150% of the total infrastructure spend in 2019.
- Every rupee of taxpayer money invested in PSBs as equity by the Government loses 23 paise. In contrast, every rupee of investor money invested in New Private Banks (NPBs) - banks licensed post-liberalization - on average gained 9.6 paise.
- The market to book ratio for PSBs is very poor in comparison to NPBs. Every rupee of taxpayer money fetches a market value of 71 paise. In stark contrast, every rupee invested in NPBs fetches a market value of ₹ 3.70.
- The primary difference between PSBs and NPBs stems from the difference in efficiencies and the costs stemming from inefficiency of PSBs are enormous.
NOTE:
The Market to Book ratio is a financial valuation metric used to evaluate a company’s current market value relative to its book value.
- Banking Structure: Nationalization to Today
- Banking in India dates back to thousands of years. Several of India's ancient texts including those in the Vedic period mention bank lending functions.
- India's public sector banks (PSBs) are essentially legacy banks from the colonial period (since 1800s) that were subsequently nationalized.
- India's largest PSB, State Bank of India (SBI), was founded as Bank of Calcutta in 1806, took the name Imperial Bank of India in 1921 and became state-owned in 1955.
- The remaining PSBs in India were formed through two waves of nationalizations, one in 1969 and the other in 1980.
- After the 1980 nationalization, PSBs had a 91% share in the national banking market with the remaining 9% held by “old private banks” (OPBs) that were not nationalized.
- PSBs continue to have a significant footprint today albeit with a market share that is less than 91%. The decline in PSB market share has been largely absorbed by “new private banks” (NPBs), which were licensed in the early 1990s after the liberalization of licensing rules.
- PSBs, OPBs, and NPBs are currently subject to similar banking regulations on virtually all aspects of their functioning including branching and priority sector lending.
Assessment of Nationalization
- The allocations of banking resources to rural areas, agriculture, and priority sectors increased. The number of rural bank branches increased ten-fold. It led to an increase in credit and deposit from rural areas.
- However, some caution is necessary in interpreting the above trends as being entirely caused by nationalisation.
- For instance, interventions like the ‘Green Revolution’ and multiple anti-poverty programmes had their own role in financial inclusion and deepening institutional credit.
- Similarly, the policies pursued by RBI after nationalization set lending targets for priority sectors. These tools carried special force given that banks were essentially operating in a marketplace sheltered from entry.
- Nevertheless, a significant portion of the poor remained unbanked till 2014 when the Pradhan Mantri Jan Dhan Yojana (PMJDY) got 18 million bank accounts opened in the first week of its launch.
Problems Faced by PSBs
- PSBs enjoy less strategic and operating freedom than private banks because of majority government ownership.
- The government exercises significant control over all aspects of PSB operations ranging from policies on recruitment and pay to investments and financing and bank governance.
- The majority ownership of the government and its writ on bank functioning also results in an implicit promise of the bailout of bank liabilities which is an implicit cost to the taxpayer.
- The majority ownership by the government also subjects PSB officers to scrutiny of their decisions by the central vigilance commission and the comptroller auditor general.
- Officers of state-run banks are wary of taking risks in lending or in renegotiating bad debt due to fears of harassment under the veil of vigilance investigations.
Microfinance institutions (MFIs)
- MFIs are financial companies that provide small loans to people who do not have any access to banking facilities. Their objective was poverty alleviation via inclusive growth and financial inclusion.
- Improved access of savings, credit, and insurance facilities enable the poor to smoothen their consumption, manage their risks better, build their assets gradually, and develop their microenterprises.
- MFIs also help poor people to manage and optimize resources over a time to develop their enterprises.
Reasons for Failure of PSBs
- As the 2014 P. J. Nayak Committee report shows, the structural weaknesses in PSBs explain their poor performance. The committee was set up by RBI to look into the governance, management and operational issues of the public sector banks.
- The banking crises are due to some combination of unsustainable macroeconomic policies, market failures, regulatory distortions, and government interference in the allocation of capital.
- A plausible explanation for the NPA problems of PSBs is that in the Indian economy’s growth phase between 2004 and 2011, PSBs grew their loan portfolios but this credit growth was of suspect quality. When the economy slowed, the banking system saw a dramatic increase in NPAs.
Ways to Enhance Efficiency of PSBs
- The key drivers of India’s growth prospects are (a) highly favourable demographics; (b) a modern and modernizing digital infrastructure that encompasses the “JAM” trinity of financial inclusion; and (c) a uniform indirect taxation system (GST). India’s growth path depends on how quickly and productively these growth levers are deployed using a well-developed financial system.
- The use of direct benefit transfers and growth in digital transactions has been significant. It has helped to bring both credit and deposits into the banking system across all geographies.
- More importantly, the inclusion is backed by state-of-art digital infrastructure that generates and stores an abundance of high quality structured data. Such data are the gold mine for economic growth in the 21st century.
- All these indicate the possibilities that exist for the Indian banking sector to grow proportionate to the scale of the Indian economy.
- PSBs have many important ingredients in place to cater to this new demand. For example, they have local market insights and relationships based on operating histories spanning many decades. Their geographic footprint is also vast.
- PSBs, however, need significant investments in the capabilities to exploit the coming data-rich environment in India.
Application of Low-cost Technology to Keep Assets Secure
- Most corporate term loans are secured and lenders have recourse to pledged assets in the event of default. However, wilful defaulters have a natural incentive to misrepresent the value of collateral. They may also pledge fictitious collateral. If they pledge genuine collateral, they have an incentive to dispose of these assets without the lender’s knowledge.
- Geo-tagging – the process of adding geographical identification such as latitude and longitude to photos, videos or other media – can help lenders keep track of the location of assets. Geo-tagging can also help verify the value of pledged land or property.
- GPS systems can confer even more monitoring power. GPS devices, when affixed to collateralized equipment or machinery, can alert lenders if these assets are moved out of the plant. It may serve lenders well if they could, say, disable a vehicular asset remotely if the borrower attempts to dispose of it or wilfully defaults on the loan.
- Integrated data on collateral across all lenders can become useful in curbing double-pledging of collateral. For example, a party may pledge the same collateral to multiple lenders to obtain multiple lines of credit for the same project.
- While these technologies are powerful, they carry an important risk, i.e., the risk of infringing upon the borrower’s privacy and dignity. Therefore, strong and clear policy guidelines are needed on what data may be collected, how, by whom and for how long.
The Benefits of Credit Analytics
- Analytics based on market data are quite capable of providing accurate predictions of corporate distress.
- The data that can be employed for credit analytics is available in both structured and unstructured form.
- Data in a structured form include credit information and credit scores based on loan grants and repayments held in the credit registries or credit bureaus.
- The unstructured micro-data is available in text, images, geo-tagged data, social network data, mobile apps, as well as other shallow or deep digital footprints of current and potential customers.
- Leveraging these data requires new data, analytics, and modelling skills. Likewise, banks need to invest in credit recovery infrastructure.
- A large proportion of NPAs of Indian banks, especially PSBs, could have been prevented if data and analytics were employed in corporate lending.
- There are several leading indicators that a robust credit analytics platform can easily pick up and provide warning signals. For instance, the systematic differences in the disclosure of related party transactions, pledging of promoter shares, and large loans to related parties.
- Similarly, an analysis of the annual reports of the large defaulters suggests that the quality of audit disclosure in these firms was very poor. Again, this is an easily detectable characteristic that a robust credit analytics platform could easily flag.
Creation of a FinTech Hub for PSBs
- FinTech or financial technology is forcing traditional banks to review their outdated business paradigms to come up with effective, low cost, banking solutions. PSBs have the maximum to gain from FinTech.
- As of now, most information processing on loans happens manually which causes inefficiency, frauds and loan defaults. PSBs also face many challenges such as high operating costs and subjective decision making.
- FinTech can radically change the way information is processed by banks. In corporate lending, for instance, a huge mass of quantitative data such as company financials and qualitative data such as company filings are machine-analysed.
- Tools such as Machine Learning (ML), Artificial Intelligence (AI) as well as Big Data provide banks the ability to recognize patterns quickly by analysing vast datasets.
- Using FinTech will allow banks to better screen borrowers and set interest rates that better predict ex-post loan performances.
- Its efficiency can be further enhanced by packaging all the information held by various PSBs into a common entity. With this, economies of scale can be utilized to make the necessary investments in undertaking analytics using AI and ML.
- An entity, called PSBN (PSB Network), shall be established on the lines of GSTN (Goods and Services Network).
- PSBs would be able to make quicker decisions, process loan applications faster, and reduce turn-aroundtimes (TAT). These would, in turn, help PSBs to compete better with NPBs.
The Case for Employee Stakes in PSBs
- The bank employees are paid through fixed and flat compensation contracts. Coupled with pressures from ex-post monitoring by the vigilance agencies, this induces conservatism and preference for safety over risk-taking even among senior executives.
- A long-term solution to this problem is enabling employees to own stakes in the PSBs and thereby incentivise them to embrace risk-taking and innovation.
- In this respect, a portion of the government stakes can be transferred to employees exhibiting good performance across all levels of the organization through Employee Stock Option Plans (ESOPs).
- Ownership by motivated, capable employees across all levels in the organization could give such employees tangible financial rewards for value enhancement, align their incentives with what is beneficial to the PSB, and create a mind-set of enterprise ownership for employees.
The Need for Best Talent
- Embracing disruptive innovations through disruptive processes requires a degree of risk-taking, a more flexible human capital acquisition strategies at all levels, and complementary incentive structures.
- This pertains to the process for recruitment of bank officials. PSBs cannot, for instance, recruit professional MBAs directly from the campuses.
- PSBs need to enable cutting-edge recruitment practices that allow lateral entry of professionals and recruitment of professionally trained talent at the entry level. For example, professionals with domain skills in technology, data science, finance, and economics.
FINANCIAL FRAGILITY IN THE NBFC SECTOR
The problems faced by the Non-Banking Financial Companies (NBFCs) stems from their over-dependence on short-term wholesale funding from the Liquid Debt Mutual Funds (LDMFs). Any asset-side shock not only exacerbates the Asset Liability Management (ALM) problem but also makes investors in LDMFs jittery leading to a redemption pressure akin to a “bank run”.
Key Points
- The liquidity crunch in the shadow banking system in India took shape in the wake of defaults on loan obligations by major NBFCs - Infrastructure Leasing & Financial Services (IL&FS) and Dewan Housing Finance Limited (DHFL).
- In response to the defaults, mutual funds started selling off their investments in the NBFC sector to reduce exposure to stressed NBFCs. Panic-stricken investors in debt mutual funds started pulling out their investments in these funds rapidly.
- The redemption pressure faced by debt mutual funds is akin to a “bank run”, a situation when a large number of customers of a bank withdraw their deposits simultaneously over concerns of the bank's solvency.
- Debt mutual funds, facing increasing redemptions, were hesitant to finance the NBFC sector. This, in turn, led to the difficulty of NBFCs to raise funds, which took a toll on the overall credit growth in the Indian economy and a decline in GDP growth. Thus, the redemption pressure gives rise to refinancing risk (rollover risk) for NBFCs.
Shadow Banking System
- Shadow banking comprises a set of activities, markets, contracts and institutions that operate partially (or fully) outside the traditional commercial banking sector. These are either lightly regulated or not regulated at all.
- A shadow banking system comprises entities that intermediate between end-suppliers and end-users of funds. However, they do not have explicit access to central bank liquidity and are highly levered with risky and illiquid assets.
- There are three important segments of the shadow banking system in India - Non-Banking Housing Finance Companies (HFCs), Retail Non-Banking Financial Companies (Retail-NBFCs) and Liquid Debt Mutual Funds (LDMFs).
Conceptual Framework of Rollover Risk
- NBFCs rely on short term financing to fund long-term investments. This reliance on short-term funding causes asset-liability management (ALM) problem because asset side shock reduces expected future cashflows for an NBFC, and thereby risk perceptions about the NBFC.
- NBFCs raise capital in the short-term commercial paper (CP) market at a lower cost. The frequent repricing of CPs exposes NBFCs to the risk of facing higher financing costs and, in the worst case, credit rationing. Such refinancing risks are referred to as Rollover Risk.
- When an asset-side shock reduces expected future cashflows for an NBFC, it adversely affects the ALM problem in the NBFC and thereby risk perceptions about the NBFC.
- Such a shock amplifies the problems of NBFCs when the liability structure is over-dependent on short-term wholesale funding, which requires frequent refinancing.
- The LDMF sector is a primary source of short-term wholesale funds in the NBFC sector. Thus, the NBFC sector is intricately connected with the LDMF sector. This interconnectedness is a channel for the transmission of systemic risk from the NBFC sector to the LDMF sector and vice-versa.
- Shocks in the NBFC sector may lead to concerted redemptions by investors in the LDMF sector. Faced with this situation, LDMFs may withdraw funding to the NBFC sector when refinancing is due. It may lead to a liquidity crisis in the NBFC sector.
- At the time of refinancing, the NBFCs having stronger balance sheets are successful in rolling over. NBFCs with weaker balance sheets face higher default probabilities.
Related Information
- Liquid Debt Mutual Funds are a category of debt mutual funds that invest in very short-term market instruments like treasury bills, government securities, and call money.
- Commercial paper is a short-term money-market security issued by large corporations to obtain funds to meet short-term debt obligations. It is not backed by collateral, only firms with excellent credit ratings are able to sell commercial paper.
Differences between HFCs and Retail-NBFCs
| Housing Finance Companies (HFCs) | Retail Non-Banking Financial Companies (Retail-NBFCs) |
| HFCs hold much longer duration assets (housing loans, developer loans, etc.). | Retail-NBFCs, hold medium-term assets (auto, consumer durables, gold loans, etc.). |
| HFCs face a greater gap between the average maturity of their assets and liabilities. | Retail-NBFCs provide loans of shorter duration in the form of working capital loans to MSME, automobile financing loans or gold loans. |
| Asset side shocks cause significant deterioration in the asset-liability mismatch of the HFCs. | Asset side shocks induce less of an adverse impact on asset-liability mismatch of Retail-NBFCs. |
| HFCs rely less on the short-term wholesale funding market and, thus, are less exposed to interconnectedness risk compared to Retail-NBFCs. | Due to their reliance on the short-term wholesale funding market Retail-NBFCs are more exposed to interconnectedness risk compared to HFCs. |
| Key drivers of Rollover Risk are ALM Risk and Financial and Operating Resilience. | Key drivers of Rollover Risk are Interconnectedness Risk and Financial and Operating Resilience. |
Risks From Asset Liability Management (ALM) Mismatch
- ALM risk arises in most financial institutions due to a mismatch in the duration of assets and liabilities. Liabilities are of much shorter duration than assets which tend to be of longer duration.
- ALM risk arises if the future contractual cash inflows from loan assets are not enough to meet the future contractual cash outflows from debt obligations. ALM risk is more problematic for HFCs than the Retail-NBFC sector.
- HFCs invest in significantly longer duration (15 to 20-year horizon) assets. HFCs’ short term liabilities (upto maturities of 3 years) are greater than their assets in these maturity buckets. Therefore, HFCs face significant rollover risk due to their ALM mismatch problem.
- In contrast, for Retail-NBFCs, the assets are greater than their liabilities with respect to the profile of cashflows for all maturity buckets. The Rollover Risk stemming from ALM mismatch is, therefore, lower for Retail- NBFCs.
Risks From Interconnectedness
- Interconnectedness Risk is a measure of the transmission of systemic risk between an NBFC and the LDMF sector.
- First, if the LDMF sector holds concentrated positions of a specific stressed NBFC, it may lead to a greater redemption risk.
- The average dependence of HFCs is lower than that of Retail-NBFCs.
Financial and Operating Resilience
- Liquidity crunch in debt markets often leads to credit rationing. Credit rationing results when firms with robust financial and operating performance get access to credit while the less robust ones are denied credit.
- Firms with robust financial and operating performance can withstand a prolonged period of liquidity crunch if they choose not to raise funds from debt mutual funds.
- Measures of financial resilience of NBFCs are commercial paper (CP) as a percentage of borrowings, Capital Adequacy Ratio (CAR) and provisioning policy.
- Measures of operating resilience are cash as a percentage of borrowings, loan quality and operating expense ratio (Opex Ratio).
- From 2015-16 onwards, large and medium-sized Retail-NBFCs had lower operating resilience as compared to HFCs and small-sized NBFCs.
Health Score to Assess Financial Fragility
- To estimate the financial fragility of the NBFC sector an Index called Health Score is developed. It ranges from -100 to +100 with the higher score indicating higher financial stability of the firm/sector.
- ALM Risk and Financial and Operating Resilience are the most important constituents of the Health Score of HFCs.
- Interconnectedness Risk between an NBFC and the LDMF sector and Financial and Operating Resilience are the most important constituents of Health Score of Retail-NBFCs.
- The Health Score for the HFC sector exhibited a declining trend post 2014. By the end of FY2019, the health of the overall sector had worsened considerably.
- The Health Score of the Retail-NBFC sector was consistently below par for the period 2014 till 2019.
- Furthermore, the large Retail-NBFCs had higher Health Scores but among medium and small Retail- NBFCs, the medium size ones had a lower Health Score.
- The Health Score can serve as a timely indicator of future performance of these firms. It can also be used by policy makers to allocate scarce capital to stressed NBFCs in an optimal way to alleviate a liquidity crisis.
PRIVATIZATION AND WEALTH CREATION
The recent approval of strategic disinvestment in Bharat Petroleum Corporation Limited (BPCL) led to a huge increase in value of its shareholders’ equity. This reflected an increase in BPCL’s overall firm value and thereby an increase in national wealth. Moreover, as stock markets reflect the current value of future cash flows of a firm, the increase in value reflected anticipated gains from consequent improvements in the efficiency of BPCL.
Benefits of Privatization/Disinvestment
- Central Public Sector Enterprises (CPSEs) are most likely to perform better in the private hands due to factors like technology up-gradation and efficient management practices. These in turn would create wealth for the economy.
- A comparison shows that the performance of the privatized CPSE and its peers is quite similar till the year of privatization. However, post privatization, the performance of the privatized entity improves significantly when compared to the change in the peers’ performance.
- Majority of privatized CPSEs witnessed improvement in net worth, net profit, gross revenue, net profit margin, sales growth in the post-privatization period compared to pre privatization period.
- Moreover, disinvestment improves firms’ overall productivity and unlocks their potential to create wealth. This would have a multiplier effect on other sectors of the economy.
- Disinvestment of CPSEs is required to bring in higher profitability, promote efficiency, increase competitiveness and to promote professionalism in management in CPSEs.
- The focus of the strategic disinvestment needs to be exit from non-strategic business and directed towards optimizing economic potential of CPSEs.
- This would, in turn, unlock capital for use elsewhere, especially in public infrastructure like roads, irrigation systems, railways and urban infrastructure. This would improve the efficient allocation of public resources.
Evolution of Disinvestment Policy in India
- The 1991 liberalization reforms ushered in an increased demand for privatization/disinvestment of PSUs.
- The government started off with disinvestment through the sale of minority stake in bundles through auction. This was followed by separate sales for each company in the following years, a method prevalent till 1999-2000.
- The next phase began in 1999-2000 by strategic sale of substantial portions (up to 50 % or more) of Government shareholding in identified CPSEs, along with transfer of management control.
- The next major shift in disinvestment policy was made in 2004-05 when it was decided that the government may dilute its equity and raise resources to meet the social needs of the people, a distinct departure from strategic sales.
- Strategic Sales have got a renewed push after 2014. During the period of 2016-17 to 2018-19, on average, strategic sales accounted for around 28.2% of total proceeds from disinvestment.
- In May 2016, the Department of Investment and Public Asset Management (DIPAM) has laid down comprehensive guidelines on Capital Restructuring of CPSEs:
- Disinvestment through minority stake sale in listed CPSEs to achieve minimum public shareholding norms of 25%.
- Listing of CPSEs to facilitate people’s ownership and improve the efficiency of companies through accountability to its stakeholders.
- Strategic Disinvestment.
- Buy-back of shares by large PSUs having huge surplus. It means a company repurchasing its own outstanding shares.
- Merger and acquisitions among PSUs.
- Launch of Exchange Traded funds (ETFs), an equity instrument that tracks a particular Index. For example, CPSE ETF.
- Monetization of select assets of CPSEs to improve their balance sheet/reduce their debts and to meet part of their capital expenditure requirements.
- NITI Aayog has been mandated to identify PSUs for strategic disinvestment. For this purpose, NITI Aayog has classified PSUs into high priority and low priority. The classification is based on national security, sovereign functions and public purpose. The PSUs falling under low priority are covered for strategic disinvestment.
The UK Model of Privatization
- The British privatization programme started in 1980.
- Methods
- An Initial Public Offering (IPO) of all or a portion of company shares to private owners for the first time.
- A direct sale or trade sale, which involves the sale of a company to an existing private company through negotiations or competitive bidding.
- An employee or management buyout, which involves the sale of company shares to employees or managers.
- In most cases, British privatizations went hand-in-hand with reforms of regulatory structures.
Way Forward
- Strategic disinvestment is guided by the basic economic principle that the Government should discontinue its engagement in manufacturing/producing goods and services in sectors where competitive markets have come of age.
- The aim of any privatization or disinvestment programme should be the maximisation of the Government’s equity stake value.
- The Government can transfer its stake in the listed CPSEs to a separate corporate entity. This entity would be managed by an independent board and would be mandated to divest the Government stake in these CPSEs over a period of time.
- This will lend professionalism and autonomy to the disinvestment programme which, in turn, would improve the economic performance of the CPSEs.
IS INDIA’S GDP GROWTH OVERSTATED? NO!
As investors deciding to invest in an economy care for the country’s Growth in Gross Domestic Product (GDP), uncertainty about its magnitude can affect investment.
Key Points
- To achieve the objective of becoming a $5 trillion economy by 2025, a strong investment climate is critical.
- The level and growth of a country’s GDP informs several critical policy initiatives as it is a barometer of the economy’s size and health. It is also a pre-eminent driver of investment and a critical variable for decision-making by investors and policymakers.
- Therefore, it is important that GDP is measured as accurately as possible. The recent debate about accuracy of India’s GDP estimation following the revised estimation methodology in 2011 is extremely significant.
Change in the Base Year of the GDP Series
- The Base Year of the GDP Series was revised from 2004-05 to 2011-12 and released on 30 January 2015.
- It was based on adaptation of the sources and methods in line with the System of National Accounts (SNA) 2008. Countries follow the SNA for the purpose of global standardization and comparability.
- The SNA 2008 is the latest version of the international statistical standard for the national accounts, adopted by the United Nations Statistical Commission (UNSC) and is an update of the earlier 1993 SNA.
- The SNA describes a coherent, consistent and integrated set of macroeconomic accounts in the context of a set of internationally agreed concepts, definitions, classifications and accounting rules.
- In addition, the SNA provides an overview of economic processes, recording how production is distributed among consumers, businesses, government and foreign nations. It shows how income originating in production, modified by taxes and transfers, flows to these groups and how they allocate these flows to consumption, saving and investment.
Is GDP Misestimated?
- The survey tried to estimate the inaccuracy, if any, in the GDP growth rate using the Difference-In-Difference (DID) methodology as implemented by other studies which calculated the misestimation.
- After closely carrying-out cross country comparison under the DID methodology, the Survey found no evidence of misestimation of India’s GDP growth. Cross-country data was gathered from the World Bank’s World Development Indicators.
- Cross-country comparisons are fraught with risks of incorrect inference. Thus, cross-country analysis has to be carefully undertaken so that correlation is distinguished from causality.
What the Economic Survey Concludes?
- There are structural differences between the Indian economy and others. To illustrate, compared to other countries, India has very high informal sector employment and a large proportion of youth that is not in employment, education or training. Agriculture contributes disproportionately to India’s employment whereas services contributes disproportionately to GDP.
- All these variables undoubtedly affect GDP, but in indirect ways that cannot be easily measured or observed. Besides, institutional and legal structures are inherently different across countries, which affect countries in ways that cannot be measured directly.
- The pattern of GDP growth in India is far more complex than what a few indicators of economic activity can predict, and therefore, asserting a mis-estimation based on these indicators alone is inappropriate.
- At the same time, more work is needed to fully understand the determinants of India’s growth rate over time. India has made impressive improvements in several social development indicators, such as access to nutrition and electricity, that might explain the higher growth rate in Indian GDP in the post-change period.
- There is also a need to invest in ramping up India’s statistical infrastructure. In this context, the setting up of the 28-member Standing Committee on Economic Statistics (SCES) headed by India’s former Chief Statistician is important.
Difference-in-difference Method
- It is a statistical technique that compares the changes in outcomes over time between the treatment group and the control group that is affected by the specific intervention such as a passage of law, enactment of policy, or large-scale program implementation.
- It is typically used to mitigate the possibility of any extraneous factors affecting the estimated impact of an intervention.
THALINOMICS: THE ECONOMICS OF A PLATE OF FOOD IN INDIA
Economics affects the common lives of people in tangible ways but this fact often remains unnoticed. A plate of food is something that people encounter every day. Thus, Thalinomics: The economics of a plate of food in India can become a prudent way to make economics relate to the common people.
Key Points
- As food is a necessity, a rapid rise in the price of a Thali has the most direct and conspicuous effect on the common man. Food and beverages constitute around 46% in the Consumer Price Index-Combined.
- Thalinomics is an attempt to quantify what a common person pays for a Thali across India.
- After 2015-16, the average household gained ₹10887 on average per year from the moderation in prices in the case of vegetarian Thali. Similarly, an average household that consumes two non-vegetarian Thalis gained around ₹11787 on average per year during the same period.
Affordability of Thali
- The price of a Thali indicates the cost of consuming a healthy plate of food but knowing whether prices are increasing or decreasing is not sufficient to infer whether the common person is better-off or worse-off.
- Hence, it is also important to see how the earnings of the individual have changed during the same period of time compared to the prices of a Thali.
- After comparing the wages with Thali prices, it was found that the affordability of Thalis has increased over the years.
- In terms of vegetarian Thali, it was found that an individual who would have spent around 70% of his/her daily wage on two Thalis in 2006- 07 is able to afford the same number of Thalis from around 50% of his daily wage in 2019-20.
- Similarly, the affordability of non-vegetarian Thalis has also increased with the share of wages required decreasing from around 93% to around 79% between 2006-07 and 2019-20.
- Many reform measures were introduced during the period of analysis to enhance the productivity of the agricultural sector as well as efficiency and effectiveness of agricultural markets for better and more transparent price discovery.
| Initiatives for Enhancing Productivity of Agriculture and Efficiency of Agricultural Markets | ||
| Sl. No. | Name of Scheme | Description |
| 01 | Pradhan Mantri Annadata Aay SanraksHan Abhiyan (PM-AASHA) | Covers three sub-schemes i.e. Price Support Scheme (PSS), Price Deficiency Payment Scheme (PDPS) and Pilot of Private Procurement & Stockist Scheme (PDPS). |
| 02 | Pradhan Mantri Krishi Sinchayee Yojana (PMKSY) - Per Drop More Crop | Focuses on enhancing water use efficiency through the expansion of cultivable area under assured irrigation, improve on-farm water use efficiency, enhance the adoption of precision-irrigation, enhance recharge of aquifers and introduce sustainable water conservation practices. |
| 03 | Pradhan Mantri Fasal Bima Yojana (PMFBY) | To provide better insurance coverage for agricultural crops and thereby mitigate risk. |
| 04 | Soil Health Card | Provides farmers information on the nutrient status of their soil along with recommendation on appropriate dosage of nutrients to be used for their soil conditions. |
| 05 | e-National Agricultural Market (e-NAM) | An online trading platform for agricultural commodities for transparent price discovery. |
| 06 | National Food Security Mission (NFSM) | Seeks to increase the production of rice, wheat, pulses and coarse cereals. |
| 07 | National Food Security Act (NFSA) | The Act legally entitles 67% of the population (75% in rural areas and 50% in urban areas) to receive highly subsidized food grains. |
Conclusion
- Food is not just an end in itself but also an essential ingredient in the growth of human capital and therefore important for national wealth creation.
- Food security is essential to achieve ‘Zero Hunger’ which has been agreed upon by nations of the world as a Sustainable Development Goal (SDG). This goal (SDG 2) is directly related to other SDGs such as Goal 1 (No poverty), Goal 4 (Quality Education), Goal 5 (Gender equality), Goal 12 (Responsible consumption and production), Goal 13 (Climate Action) and Goal 15 (Life on Land).