World Inequality Report 2026 | 13 Dec 2025
For Prelims: World Inequality Report 2026, World Inequality Lab, PPP, GDP, Labor Force Participation Rate, Unemployment, Progressive Tax.
For Mains: Key findings of the World Inequality Report 2026 and proposed policy solutions as per for reducing inequality. Status of India in WIR 2026 and Steps taken by India to reduce inequality.
Why in News?
The 3rd World Inequality Report 2026 (WIR 2026), released by the World Inequality Lab, highlights unprecedented global inequality across income, wealth, gender, climate responsibility, and territorial divides, calling for urgent policy interventions.
Summary
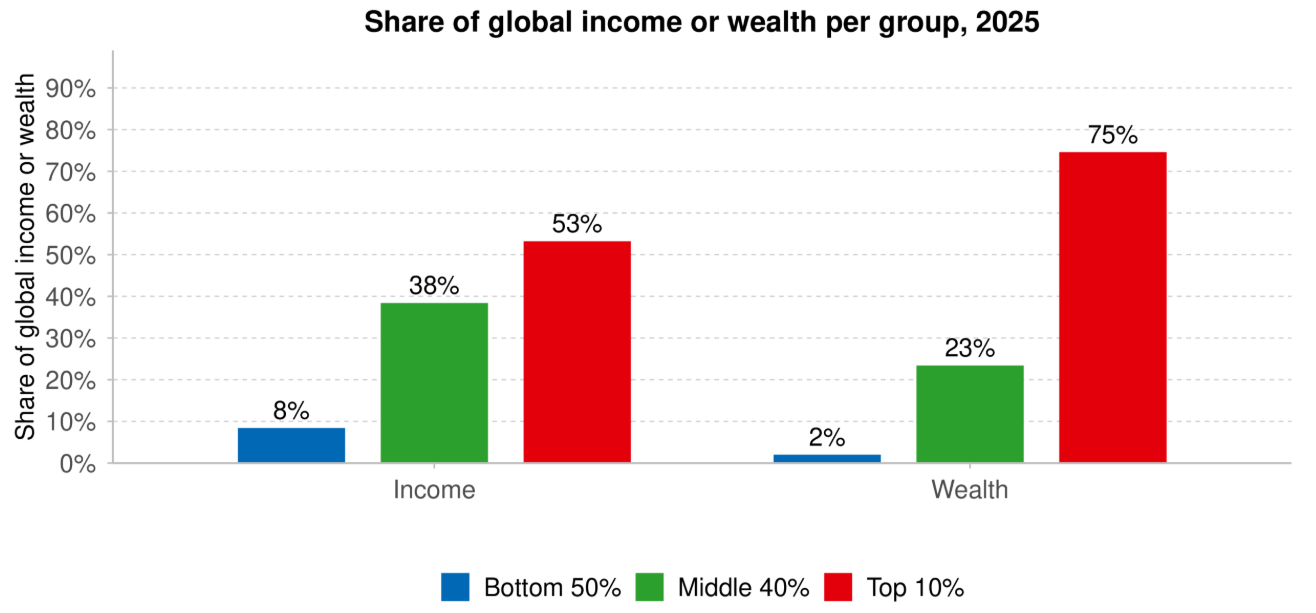
- The report highlights global inequality, with the top 10% owning 75% of wealth and responsible for 77% of capital-linked emissions.
- Inequality is multi-dimensional, spanning income, wealth, gender, climate responsibility, and geography, with mutually reinforcing effects.
- The report suggests progressive taxation, gender-equal policies, and global financial reform to promote equitable societies.
What are the Key Findings of the World Inequality Report 2026?
- Extreme Wealth Concentration: The top 10% own three-quarters of global wealth, while the bottom half holds only 2%.
- The wealthiest 0.001% (around 60,000 multi-millionaires) control 3 times more wealth than half of humanity combined. Their share grew from 4% in 1995 to over 6% in 2025.
- Human Capital Inequality: Average education spending per child in Sub-Saharan Africa is Euros 220 (PPP), compared to Euros 7,430 in Europe and Euros 9,020 in North America & Oceania — over 40 times lower.
- Climate Inequality: The wealthiest 10% account for 77% of global emissions associated with private capital ownership, while the poorest half accounts for only 3%.
- Those who emit the least (populations in low-income countries) are most exposed to climate shocks, while high emitters have resources to adapt.
- Gender Inequality: Women work 53 hours per week on average vs 43 for men (including domestic and care work).
- Excluding unpaid work, women earn 61% of men's hourly income; including unpaid labor, this falls to just 32%.
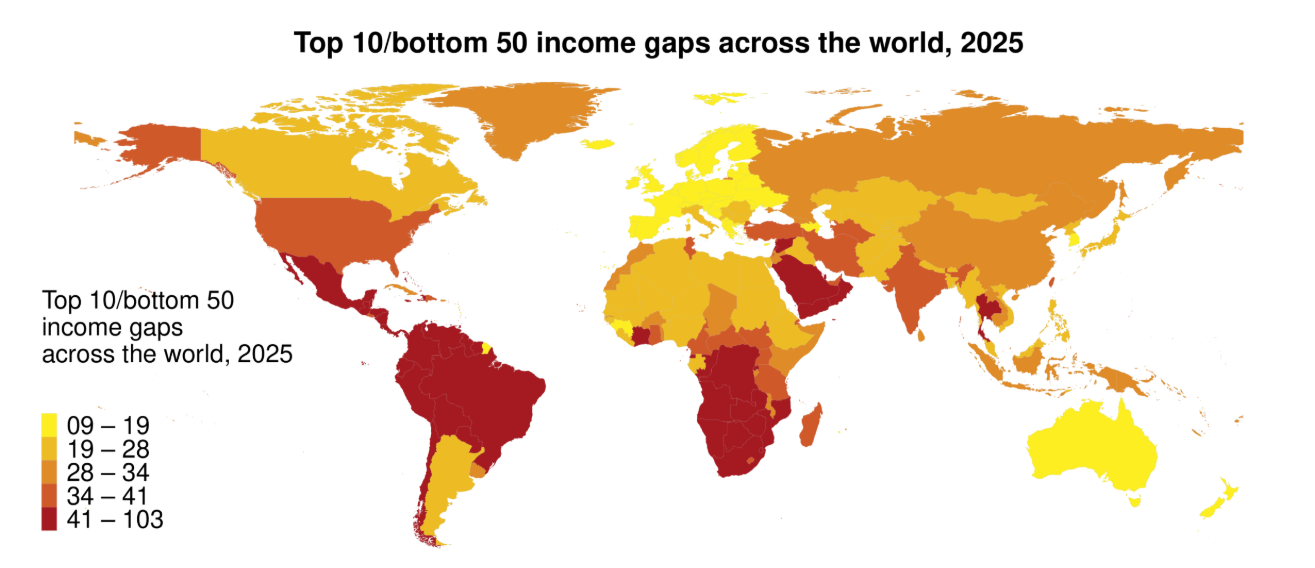
- Regional Income Inequality: Average daily income in North America & Oceania is Euros 125, compared to only Euros 10 in Sub-Saharan Africa — a 13-fold difference. The Top 10%/Bottom 50% income ratio reveals severe inequality within countries.
- Global Financial System Inequality: Annually, a net financial transfer equal to 1% of global GDP—3 times total development aid—moves from poorer to wealthier nations due to demand for US and European sovereign bonds.
What are the Key Findings Related to India in the World Inequality Report 2026?
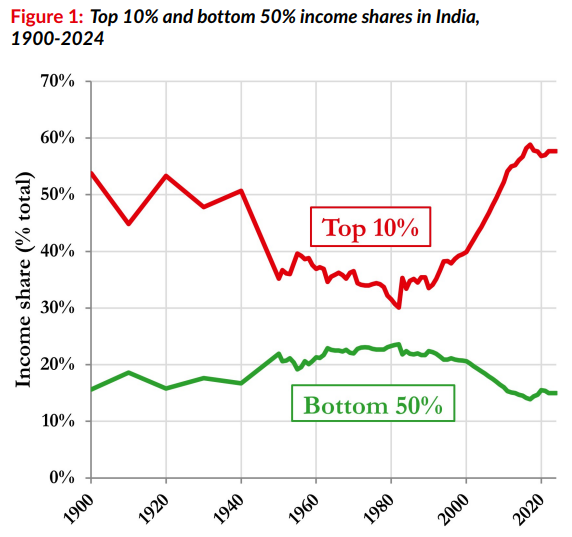
- Income Inequality: The top 10% of earners capture a disproportionate 58% of the national income. In contrast, the bottom 50% of the population receives only 15%.
- Wealth Concentration: The richest 10% hold around 65% of the nation's total wealth. The top 1% alone holds about 40% of total wealth.
- Low Female Labor Force Participation: The female labor force participation rate is only 15.7%, one of the lowest in the world.
- Average Prosperity: The average annual income per capita is approximately Euros 6,200 (PPP), and average wealth is about Euros 28,000 (PPP).
World Inequality Report
- About: The World Inequality Report is a major global publication that provides comprehensive data and analysis on the distribution of income and wealth across countries and over time.
- It is produced by the World Inequality Lab, a research center based at the Paris School of Economics.
- Key Features of the Report: It provides a deeper assessment of global income and wealth distribution, moving beyond conventional metrics like GDP.
- It uses a multidimensional lens, covering gender inequality, climate impact, and access to public services.
What are the Key Policy Recommendations Made in World Inequality Report 2026?
|
Policy Area |
Core Objective |
Recommendations |
|
Public Investment in Human Capital |
Equalize life chances from the start and build an inclusive society. |
Invest in free, high-quality education, universal healthcare, childcare, and nutrition programs. |
|
Redistribution & Social Protection |
Shift resources directly to lower-income groups and provide stability. |
Implement cash transfers, pensions, and unemployment benefits for vulnerable households. |
|
Advancing Gender Equality |
Dismantle structural barriers and redistribute unpaid care work. |
Provide affordable childcare, equitable parental leave, and enforce equal pay laws. |
|
Progressive & Green Taxation |
Mobilize public resources fairly and align fiscal policy with climate goals. |
Enact progressive wealth/income taxes and use taxes/subsidies to promote low-carbon technologies. |
|
Reforming Global Financial System |
Correct systemic biases that transfer resources from poor to rich nations. |
Explore new global currency arrangements systems to reduce unequal financial flows. |
India’s Initiatives to Reduce Inequality
- Mahatma Gandhi National Rural Employment Guarantee Act Scheme (MGNREGA)
- Prime Minister’s Employment Generation Programme (PMEGP)
- Deendayal Antyodaya Yojana- National Urban Livelihoods Mission (DAY-NULM)
- Samagra Shiksha Scheme 2.0
- Pradhan Mantri Jan Dhan Yojana
- Lakhpati Didi Initiative
Conclusion
The World Inequality Report 2026 reveals an interconnected crisis of extreme economic, environmental, and social disparities. While the data shows that inequality is a political choice, the proposed multi-dimensional policy solutions and existing national initiatives highlight a clear, actionable path toward building more equitable and resilient societies.
|
Drishti Mains Question: Q. Examine the multidimensional nature of global inequality as highlighted in the World Inequality Report 2026. What comprehensive steps, integrating fiscal and social policy, are needed to forge an effective and equitable development path for India? |
Frequently Asked Questions (FAQs)
1. What does WIR 2026 reveal about global wealth concentration?
The top 10% hold 75% of global wealth, while the bottom 50% owns only 2%; the top 0.001% controls three times more wealth than half of humanity.
2. How is climate inequality linked to wealth?
The wealthiest 10% account for 77% of emissions from private capital; the top 1% alone contribute 41%, showing unequal responsibility and risk.
3. What does the report identify as a primary reason for persistent high inequality in India?
Inequality in India is entrenched, with the top 10% capturing 58% of national income and the top 1% holding 40% of wealth, exacerbated by a stagnant female labour force participation rate of 15.7%.
UPSC Civil Services Examination, Previous Year Question (PYQ)
Prelims
Q.Inclusive growth as enunciated in the Eleventh Five Year Plan does not include one of the following: (2010)
(a) Reduction of poverty
(b) Extension of employment opportunities
(c) Strengthening of capital market
(d) Reduction of gender inequality
Ans: (c)
Mains
Q. COVID-19 pandemic accelerated class inequalities and poverty in India. Comment. (2020)