Manufacturing Hits Record Low | 05 May 2020
Why in News
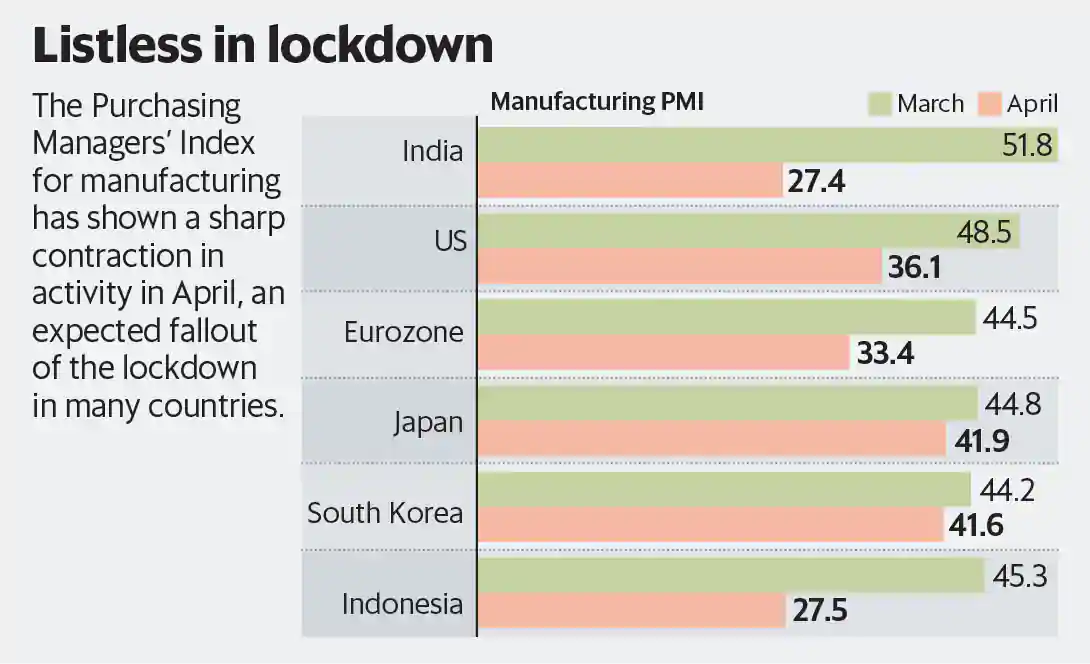
According to a recent IHS Markit India monthly survey, Manufacturing Purchasing Managers’ Index (PMI) fell to 27.4 in April, 2020 from 51.8 in March, 2020.
Key Points
- India’s manufacturing sector activity has witnessed contraction in April, 2020 due to national lockdown restrictions.
- The new business orders have collapsed at a record pace severely hampering the demand.
- This is the sharpest deterioration in business conditions across the manufacturing sector since data collection began over 15 years ago.
- The deteriorating demand conditions has led the manufacturers to drastically cut back staff numbers.
- Export orders have also witnessed a sharp decline.
- There was also evidence of supply-side disruption due to the lockdown.
- The PMI slipped into contraction mode, after remaining in the growth territory for 32 consecutive months.
- In PMI’s language, a reading above 50 means expansion, while a score below that denotes contraction.
- According to the 12-month outlook for production the demand will rebound once the Covid-19 threat is diminished and lockdown restrictions are eased.
- The Index (PMI) is compiled by IHS Markit for more than 40 economies worldwide. IHS Markit is a global leader in information, analytics and solutions for the major industries and markets that drive economies worldwide.
Purchasing Managers' Index
- Purchasing Managers’ Index (PMI) is an indicator of business activity - both in the manufacturing and services sectors.
- It is calculated separately for the manufacturing and services sectors and then a composite index is also constructed.
- The PMI summarizes whether market conditions as viewed by purchasing managers are expanding, neutral, or contracting.
- The purpose of the PMI is to provide information about current and future business conditions to company decision makers, analysts, and investors.
- The PMI is a number from 0 to 100.
- PMI above 50 represents an expansion when compared to the previous month;
- PMI under 50 represents a contraction, and
- A reading at 50 indicates no change.
- The PMI is usually released at the start of every month. It is, therefore, considered a good leading indicator of economic activity.
- It is different from the Index of Industrial Production (IIP), which also gauges the level of activity in the economy.
Index of Industrial Production
- The Index of Industrial Production (IIP) is an index which details out the growth of various sectors in an economy such as mineral mining, electricity, manufacturing, etc.
- It is compiled and published monthly by the National Statistical Organisation (NSO), Ministry of Statistics and Programme Implementation.
- The Base Year of the Index of Eight Core Industries has been revised from the year 2004-05 to 2011-12 from April, 2017.
- The eight core industries comprise 40.27% of the weight of items included in the Index of Industrial Production (IIP).
- The eight Core Industries in decreasing order of their weightage: Refinery Products> Electricity> Steel> Coal> Crude Oil> Natural Gas> Cement> Fertilizers.
Difference between PMI and IIP
- IIP covers the broader industrial sector compared to PMI.
- IIP shows the change in production volume in major industrial sub sectors like manufacturing, mining and electricity.
- Similarly, the IIP also gives use based (capital goods, consumer goods etc) trends in industrial production.
- PMI is more dynamic compared to a standard industrial production index.
- The PMI senses dynamic trends because of the variable it uses for the construction of the index compared to volume based production indicators like the IIP.
- For example, new orders under PMI show growth oriented positive trends and not just volume of past production that can be traced in an ordinary Index of Industrial Production.