Global Multidimensional Poverty Index 2025 | 23 Oct 2025
For Prelims: United Nations Development Programme, Global Multidimensional Poverty Index, Air Pollution, Undernutrition, Headcount Ratio, Purchasing Power Parity, Extreme Poverty.
For Mains: Findings of Global Multidimensional Poverty Index 2025, Features and computation of Global Multidimensional Poverty Index.
Why in News?
The United Nations Development Programme (UNDP) and the Oxford Poverty and Human Development Initiative (OPHI), has published its 2025 Global Multidimensional Poverty Index (MPI) under the title "Overlapping Hardships: Poverty and Climate Hazards."
- For the first time, it overlays climate hazard data with multidimensional poverty to assess poor people’s exposure to climate shocks, focusing on high heat, drought, floods, and air pollution.
What are Key Findings of the Global MPI Report 2025?
- Global Poverty Statistics: Of 6.3 billion people across 109 countries, 1.1 billion (18.3%) live in acute multidimensional poverty, mostly young, rural, and in low human development countries.
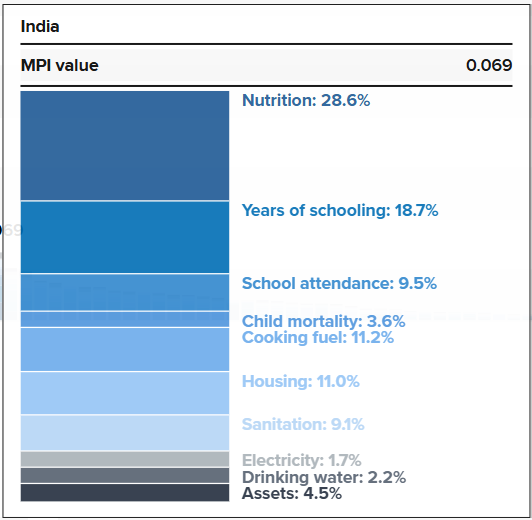
- Multi-dimensional Poverty in India: Poverty fell from 55.1% (2005–2006) to 16.4% (2019–2021). Large areas of India face a severe mix of poverty, high heat, flooding, and air pollution.
- Poverty and Climate Interlinkages: Climate shocks are growing more frequent and intense, displacing 32 million people in 2022. Without strong climate mitigation, extreme poverty could nearly double by 2050.
- 309 million poor people live in areas with three or four overlapping climate hazards and severe poverty, facing a "triple or quadruple burden" with few assets and little social protection.
- MPI Across Income Levels: About two-thirds (64.5%) of the world’s poor live in middle-income countries, with 55.5% in lower-middle-income and 9% in upper-middle-income nations.
- Common Deprivations: Major deprivations include clean cooking fuel (970 million), adequate housing (878 million), sanitation (830 million), undernutrition (635 million), and out-of-school children (487 million).
- Uneven Progress in MPI Reduction: Of 88 countries with comparable data, 76 have seen a decline in MPI at least once.
- Benin recorded the fastest absolute reduction (2017–2018 to 2021–2022), followed by Cambodia (2014 to 2021–2022) and Tanzania (2015–2016 to 2022).
What is the Multidimensional Poverty Index (MPI)?
- About: The MPI is a sophisticated tool that extends beyond income to capture the multiple, overlapping deprivations faced by poor people.
- Its main purpose is to complement income-based poverty measures (such as the USD 3.00/day rate) by providing a comprehensive view of non-monetary deprivations, enabling more effective and targeted policy interventions.
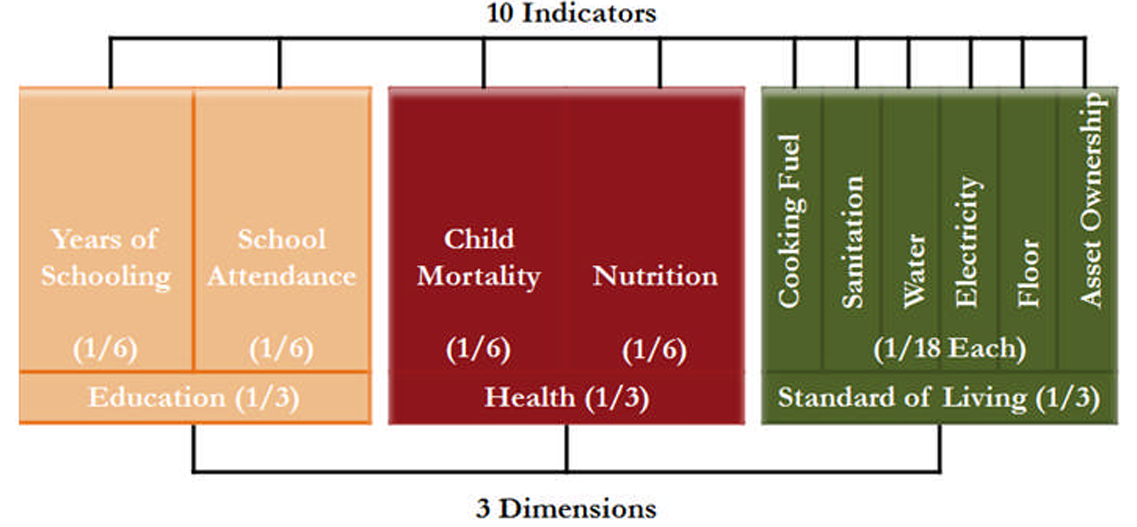
- Weighting System: The indicators are not all weighted equally, but the dimensions are balanced. Health, Education, and Standard of Living each receive 1/3 of the total weight.
- Each health and education indicator is weighted 1/6 (because there are 2 indicators per dimension).
- Each standard of living indicator is weighted 1/18 (because there are 6 indicators per dimension).
- Computation: The index is built on three core dimensions of poverty: Health, Education, and Standard of Living. These are broken down into 10 specific indicators:
- Health (2 indicators): Nutrition (any person under 70 years of age is undernourished), Child Mortality (death of any child in the household in the past 5 years).
- Education (2 indicators): Years of Schooling (no household member has completed 6 years of formal education), School Attendance (any child is not enrolled in school up to class 8).
- Standard of Living (6 indicators): Cooking Fuel, Sanitation, Drinking Water, Electricity, Housing, Assets.
- Identification of Poor: A person is identified as multidimensionally poor if their deprivation score is one third (33.3%) or higher. The final MPI value for a country or region is a product of two critical components (MPI = H × A):
- H - Incidence of Poverty: The proportion of the population who are multidimensionally poor (the headcount ratio).
- A - Intensity of Poverty: The average proportion of weighted deprivations poor people experience. It answers "how poor are the poor?" on average.
- MPI values range from 0 to 1, and higher values imply higher poverty.
What are the Key Indian Government Initiatives Related to Poverty Alleviation?
What are the Key Challenges to Poverty Alleviation in India, and How can they be Addressed?
|
Key Challenges |
Required Measures |
|
Multidimensional Deprivations: Poverty extends beyond low income to include overlapping deficits in health (malnutrition), education (low attainment), and standard of living (sanitation, housing). |
Convergence of Welfare Schemes: Integrate programs like POSHAN Abhiyan (health), Samagra Shiksha (education), and PM Awas Yojana (housing) for a holistic approach to address all deprivations simultaneously. |
|
Vulnerability to Climate Shocks: The poor, often in climate-sensitive sectors like agriculture, are disproportionately affected by floods, droughts, and heatwaves, which can wipe out gains and cause descent into poverty. |
Promoting Climate-Resilient Agriculture & Insurance: Expand PM Fasal Bima Yojana (crop insurance), promote drought-resistant crops, and develop climate risk insurance to protect livelihoods and assets. |
|
Large Informal Sector Workforce: A vast majority of the poor work in the informal economy with no job security, social safety nets, or decent wages, making them highly vulnerable to economic shocks. |
Universal Social Security & Skill Development: Implement schemes like e-Shram and Pradhan Mantri Shram Yogi Maan-dhan for pensions, and Skill India Mission to enhance employability in formal sectors. |
|
Regional & Social Disparities: Poverty is concentrated in specific regions (e.g., eastern states), among Scheduled Castes (SCs), Scheduled Tribes (STs), and other marginalized groups, leading to uneven development. |
Targeted Interventions & Affirmative Action: Strengthen the Aspirational Districts Programme for backward regions and ensure effective implementation of SC/ST sub-plans and scholarships to bridge the gap. |
|
Agricultural Distress: A large section of the poor are small and marginal farmers facing challenges of low productivity, debt, and lack of market access, leading to low and unstable incomes. |
Income Support & Market Reforms: Provide direct income support through PM-KISAN, promote Farmer Producer Organizations (FPOs) for better market access, and improve infrastructure through the Agriculture Infrastructure Fund. |
Kerala: First Indian State Free of Extreme Poverty
- On 1st November, 2025, Kerala will become the first state in India to be officially declared free from extreme poverty.
- According to the World Bank, extreme poverty is defined as living on less than USD 3.00 per person per day at 2021 purchasing power parity.
- In Kerala, the extreme poverty eradication programme, launched in 2021, started with the identification of around 64,000 extremely poor families via ground-level surveys evaluating deprivations in food, health, livelihood, and shelter.
- The government prepared micro-plans for each family to address both immediate and long-term needs, including the provision of essential documents, housing, land, and house repair assistance.
Conclusion
The 2025 MPI report underscores the critical intersection of poverty and climate hazards, threatening to reverse global gains. While India has made significant progress, with Kerala eliminating extreme poverty, the overlapping deprivations and climate exposure of its poor population demand urgent, integrated policy interventions for sustainable development.
|
Drishti Mains Question: What is the Multidimensional Poverty Index (MPI)? Discuss the significance of the MPI in measuring poverty beyond income and its policy implications in India. |
Frequently Asked Questions (FAQs)
1. What is the Global Multidimensional Poverty Index (MPI)?
MPI measures poverty beyond income, capturing deprivations in health, education, and living standards to inform targeted policy interventions.
2. Which indicators are used to compute the MPI?
Ten indicators across Health (Nutrition, Child Mortality), Education (Years of Schooling, School Attendance), and Standard of Living (Cooking Fuel, Sanitation, Drinking Water, Electricity, Housing, Assets).
3. How is a person identified as multidimensionally poor?
A person is considered poor if their deprivation score is ≥ 33.3%, calculated using weighted indicators in the three core dimensions.
4. What are the key findings of the Global MPI 2025 for India?
India reduced poverty from 55.1% (2005–06) to 16.4% (2019–21); large regions still face overlapping hazards like heat, floods, and air pollution.
UPSC Civil Services Examination Previous Year Question (PYQ)
Prelims
Q. The Multi-dimensional Poverty Index developed by Oxford Poverty and Human Development Initiative with UNDP support covers which of the following? (2012)
- Deprivation of education, health, assets and services at household level
- Purchasing power parity at national level
- Extent of budget deficit and GDP growth rate at national level
Select the correct answer using the codes given below:
(a) 1 only
(b) 2 and 3 only
(c) 1 and 3 only
(d) 1, 2 and 3
Ans: (a)
Mains
Q. Despite consistent experience of high growth, India still goes with the lowest indicators of human development. Examine the issues that make balanced and inclusive development elusive. (2016)