Contraction in Index of Industrial Production | 13 Dec 2019
Why in News
According to the data released by the Ministry of Statistics and Programme Implementation (MoSPI), the quick estimates of Index of Industrial Production (IIP) stands at 127.7 for October 2019, which is 3.8% lower as compared to the level in the month of October 2018. This contraction is due to demand slump in economy and fall in activity across sectors such as manufacturing, electricity, infrastructure etc.
- Retail inflation (measured by the Consumer Price Index) surged to a 40-month high of 5.54% in November 2019, owing to rising food inflation.
- The combination of contraction in industrial activity and rising inflation has led experts to fear that India is entering a phase of stagflation.
Stagflation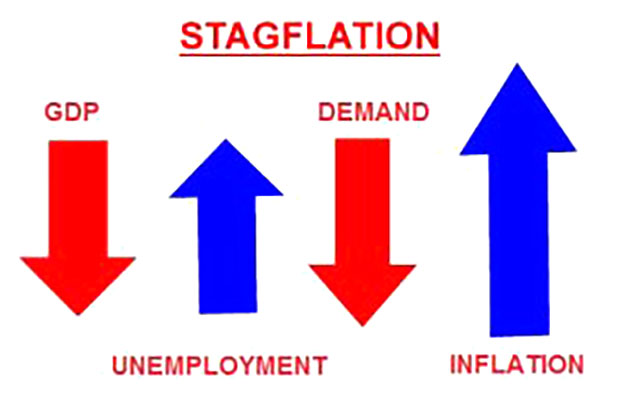
- Stagflation means a situation characterized by simultaneous increase in prices and stagnation of economic growth.
- It is described as a situation in the economy where the growth rate slows down, the level of unemployment remains steadily high and yet the inflation or price level remains high at the same time.
- Dangerous for the economy
- In a usual low growth situation, central banks and government try to stimulate the economy through higher public spending and low interest rates to create demand.
- These measures also tend to elevate prices and cause inflation. So, these tools cannot be adopted when inflation is already running high, which makes it difficult to break out of low growth-high inflation trap.
- The solution lies in increasing productivity, this enables higher growth without inflation.
Index of Industrial Production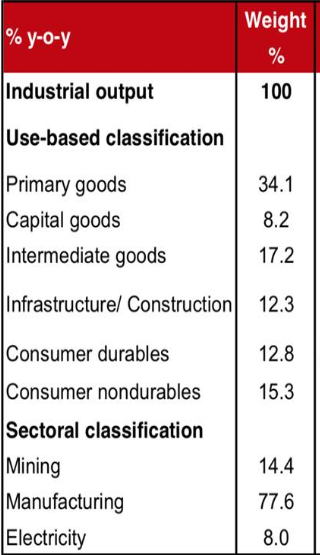
- The Index of Industrial Production (IIP) maps the change in the volume of production in Indian industries.
- It is estimated and published on a monthly basis by the Central Statistical Organisation (CSO) under MoSPI.
- It is currently calculated using 2011-2012 as the base year.
- The IIP is basically divided into three sectors, though a use-based classification is also provided by the CSO.
- The three sectors include: Mining, Manufacturing and Electricity.
- Electricity, crude oil, coal, cement, steel, refinery products, natural gas, and fertilisers are the eight core industries that comprise about 40% of the weight of items included in the Index of Industrial Production.
- Use based classification include: Primary Goods, Capital Goods, Intermediate Goods, Infrastructure/ Construction goods, Consumer durables and Consumer nondurables.
- The three sectors include: Mining, Manufacturing and Electricity.
- Calculation
- The index is created by giving different weights to each sector and every month, production is tracked.
- Finally, the index value is compared to the value it had in the same month last year to figure out the economy’s industrial health.
Consumer Price Index
- Inflation refers to the rise in the prices of most goods and services of daily or common use, such as food, clothing, housing, recreation, transport, consumer staples, etc.
- It measures the average price change in a basket of commodities and services over time. The opposite and rare fall in the price index of this basket of items is called ‘deflation’.
- It is indicative of the decrease in the purchasing power of a unit of a country’s currency. This is measured in percentage.
- In India, inflation is primarily measured by two main indices — WPI (Wholesale Price Index) and CPI (Consumer Price Index), which measures wholesale and retail-level price changes, respectively.
- The goods or services sold by businesses to smaller businesses for selling further is captured by the WPI.
- The CPI is an index measuring retail inflation in the economy by collecting the change in prices of most common goods and services used by consumers.